


Connecting to SLS Data Source
When creating a data source connection, the main parameters to fill in are:
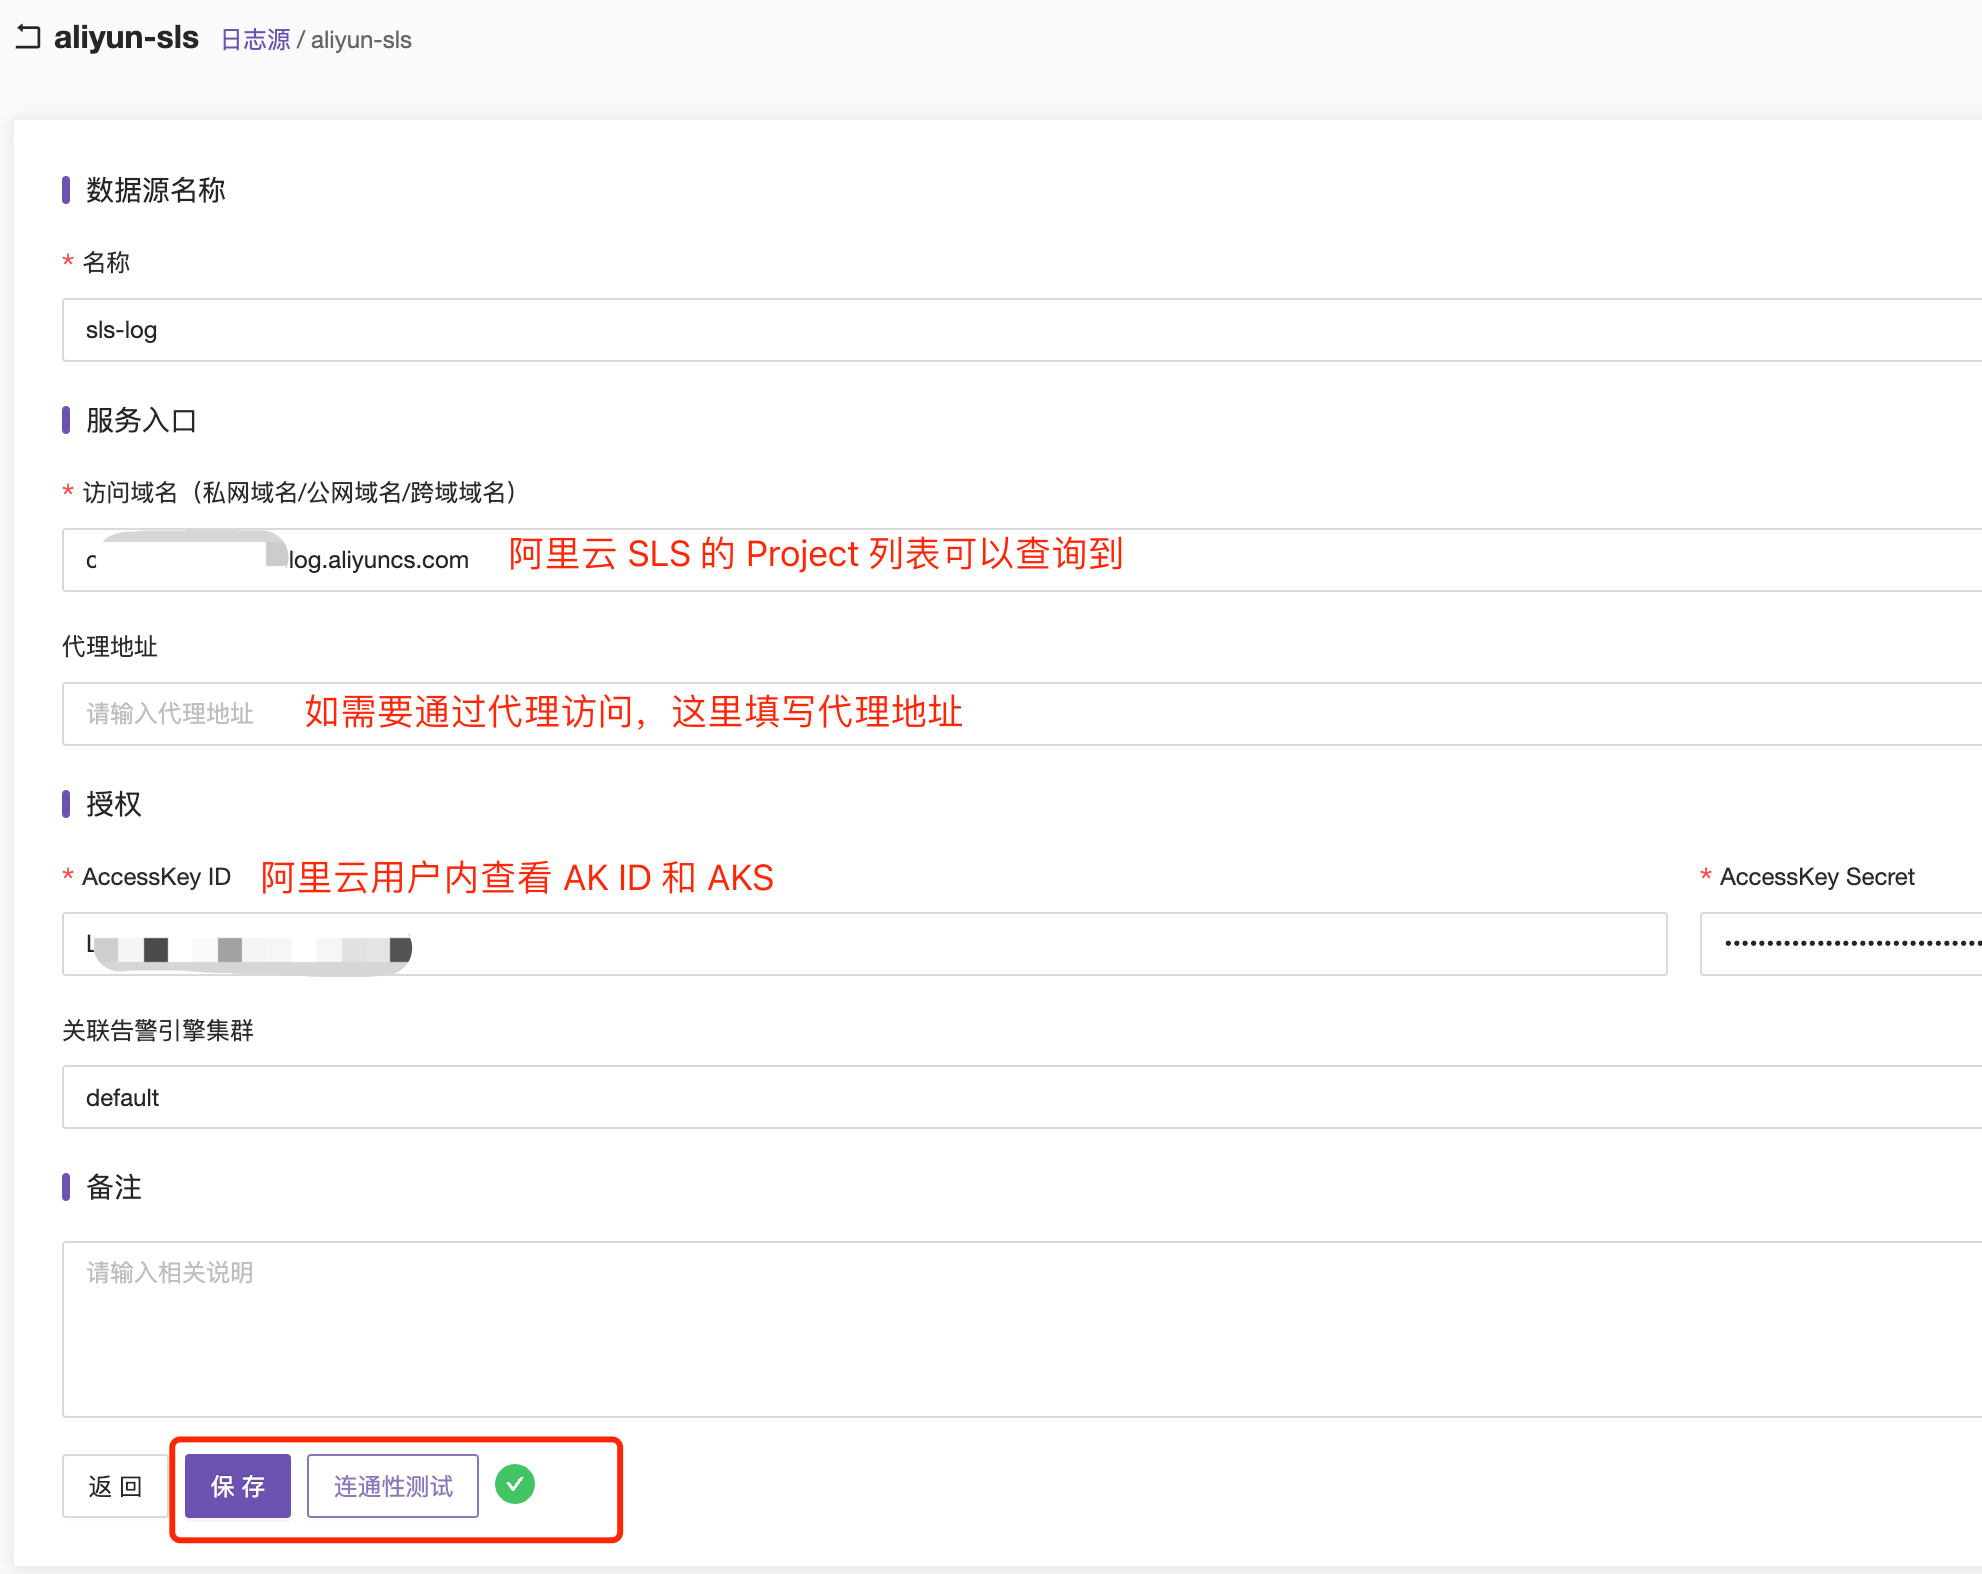
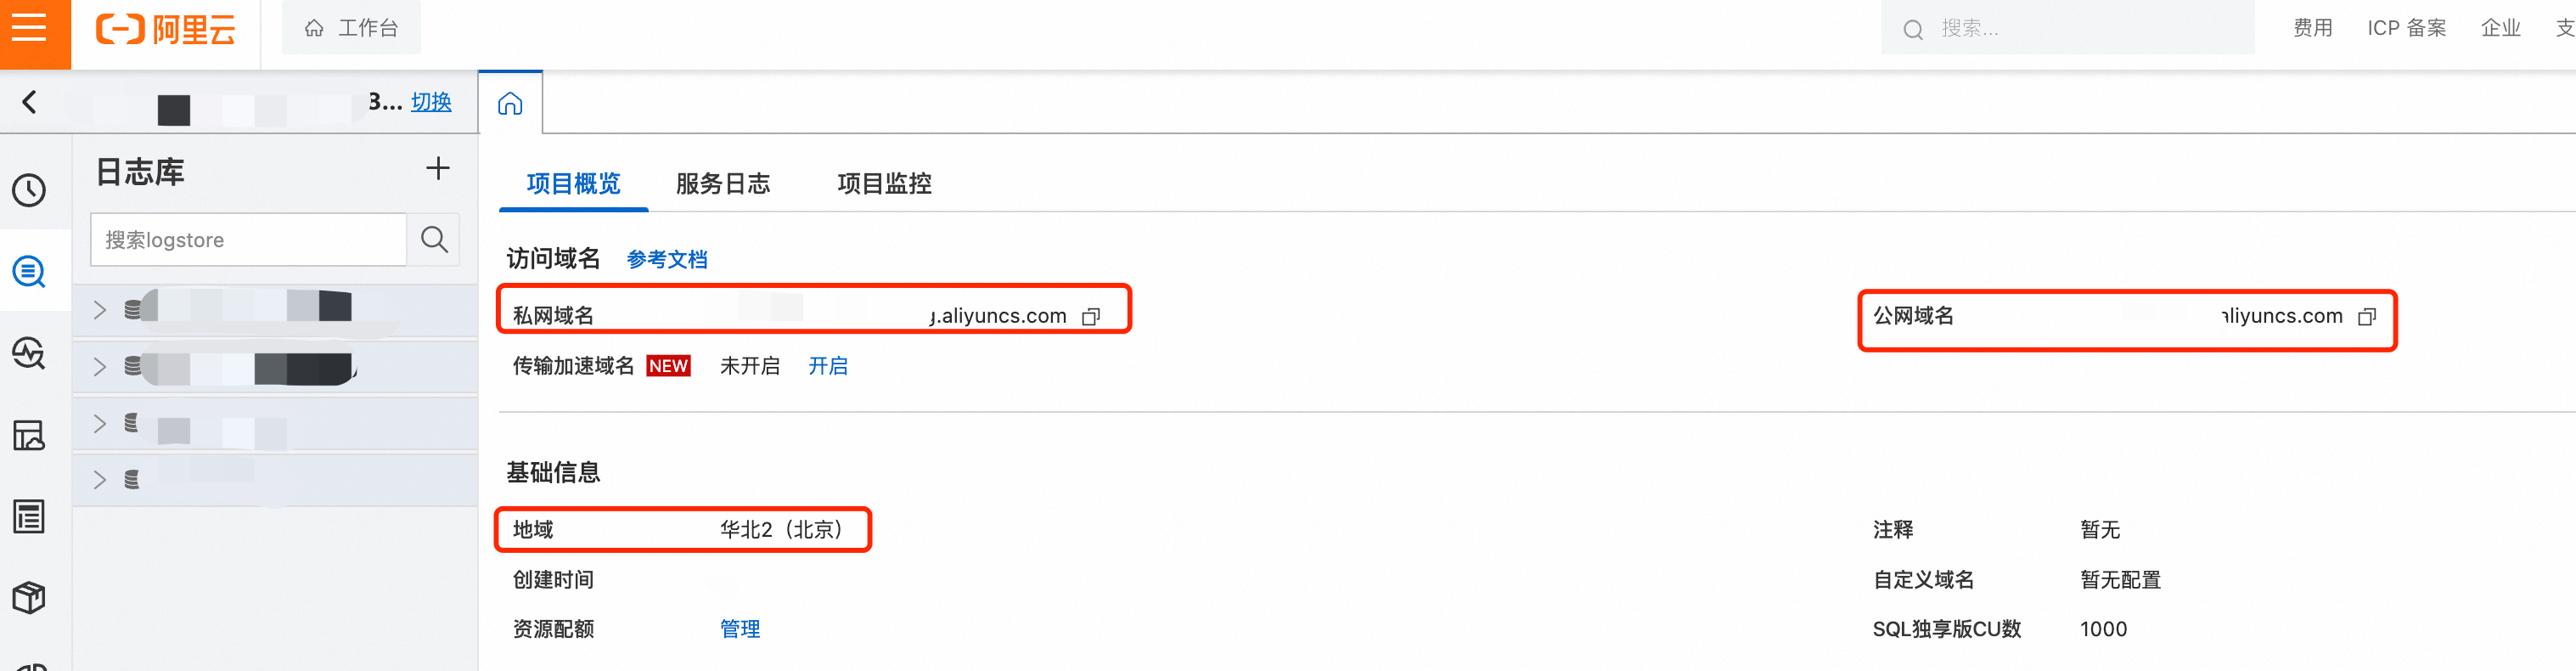
Access Domain can be found in the Project of Alibaba Cloud SLS. If the FlashCat deployment host and Alibaba Cloud SLS are in the same region, it is recommended to use a private network domain name. If the FlashCat deployment host is not in an Alibaba Cloud environment, it is recommended to use a public network domain name. If FlashCat is deployed in a private cloud, you need to fill in the outbound proxy address to access the public network domain name; as shown in the figure below.
 AK ID and AKS: Can be viewed and created in the AccessKey management of Alibaba Cloud.
SLS Log Query
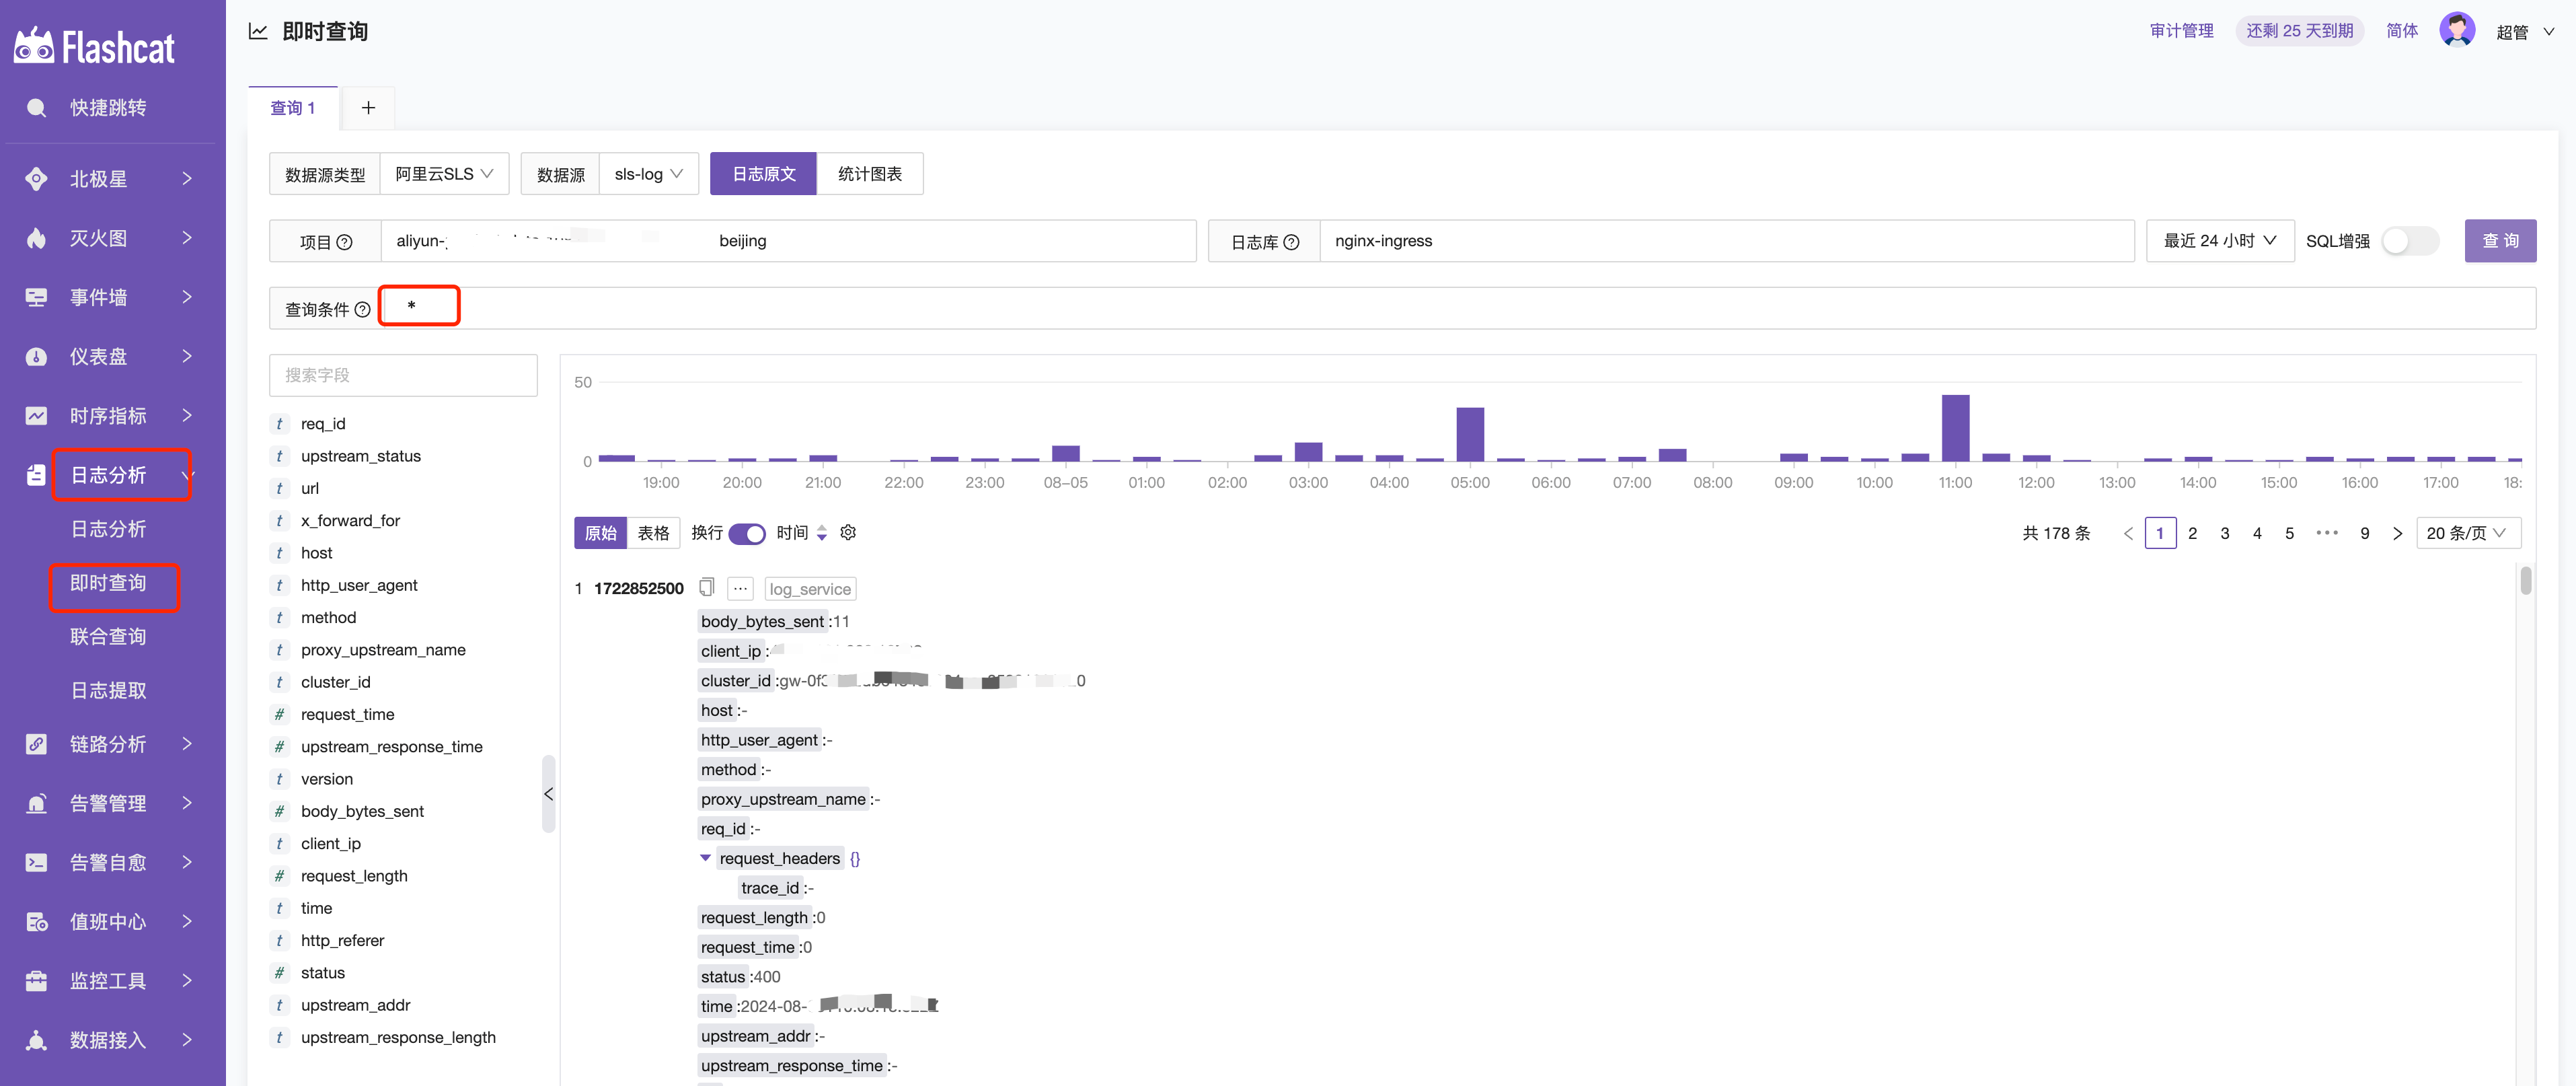
Raw Logs
Displays the source data from Alibaba Cloud SLS, unprocessed.
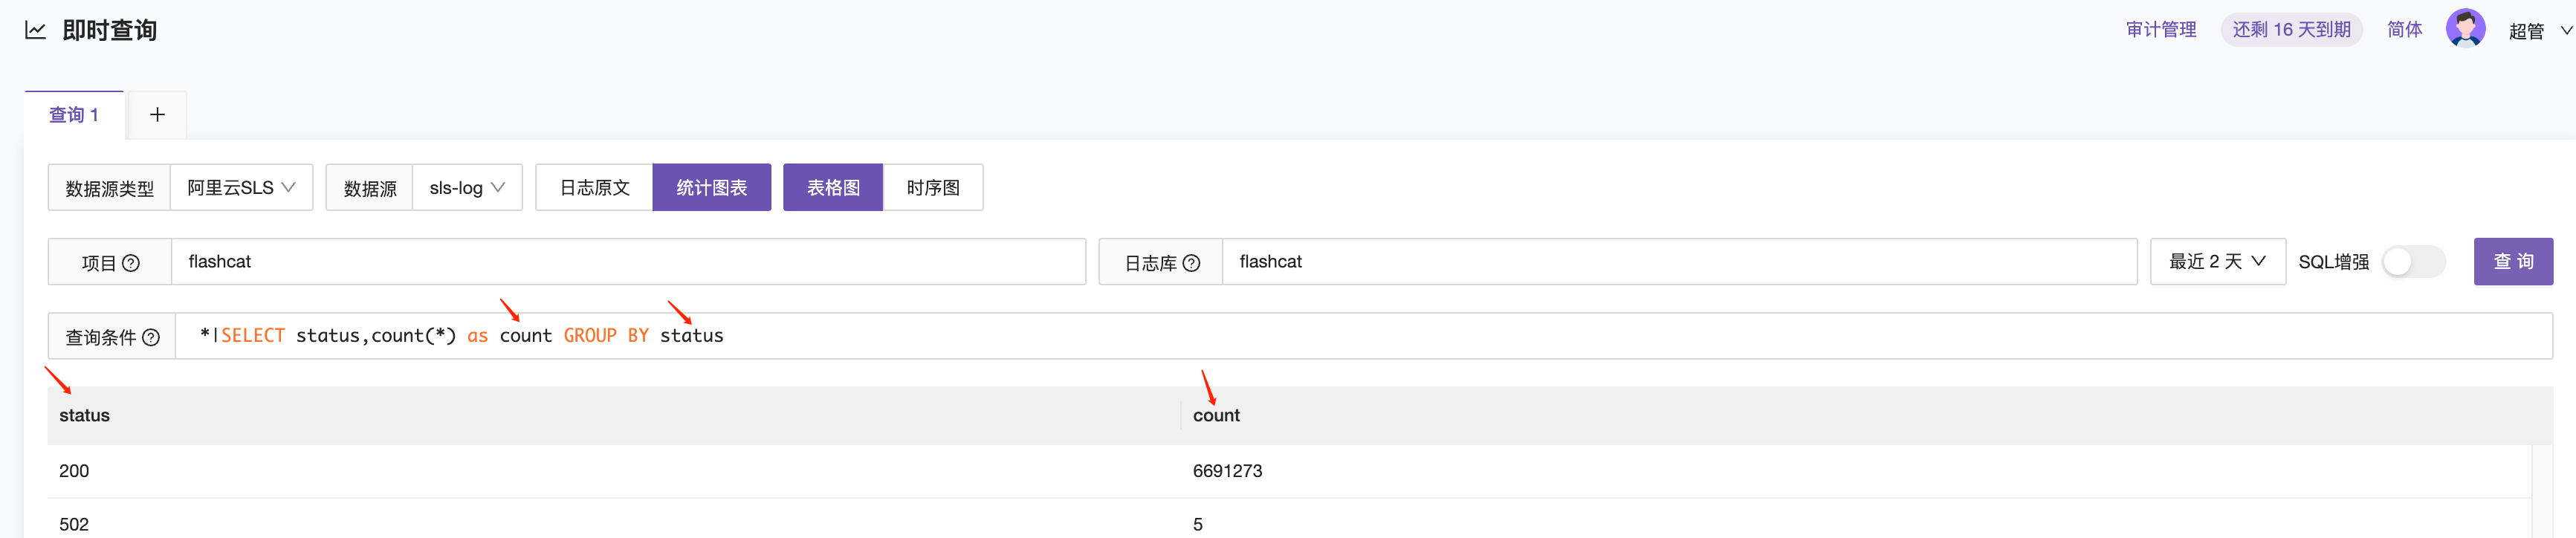
Statistical Charts
The statistical chart displays the results of the query conditions, with two display options: table chart and time-series chart.
Table Chart
For example, with the query condition *|SELECT status,count(*) as count GROUP BY status, it queries the status field, counts the result, and names it count, then groups the result by status to display it in a table.
Syntax Analysis
*| select ...
Explanation: | The part on the left of the pipe symbol * is the query statement; the part on the right select... is the analysis statement.
status: Refers to a field in the log data.
count() AS count: Counts each type of status and names the count result as count.
GROUP BY status: Groups the query results by the status field.
For more syntax learning, you can refer to: Query Syntax, Analysis Syntax, Function Overview.
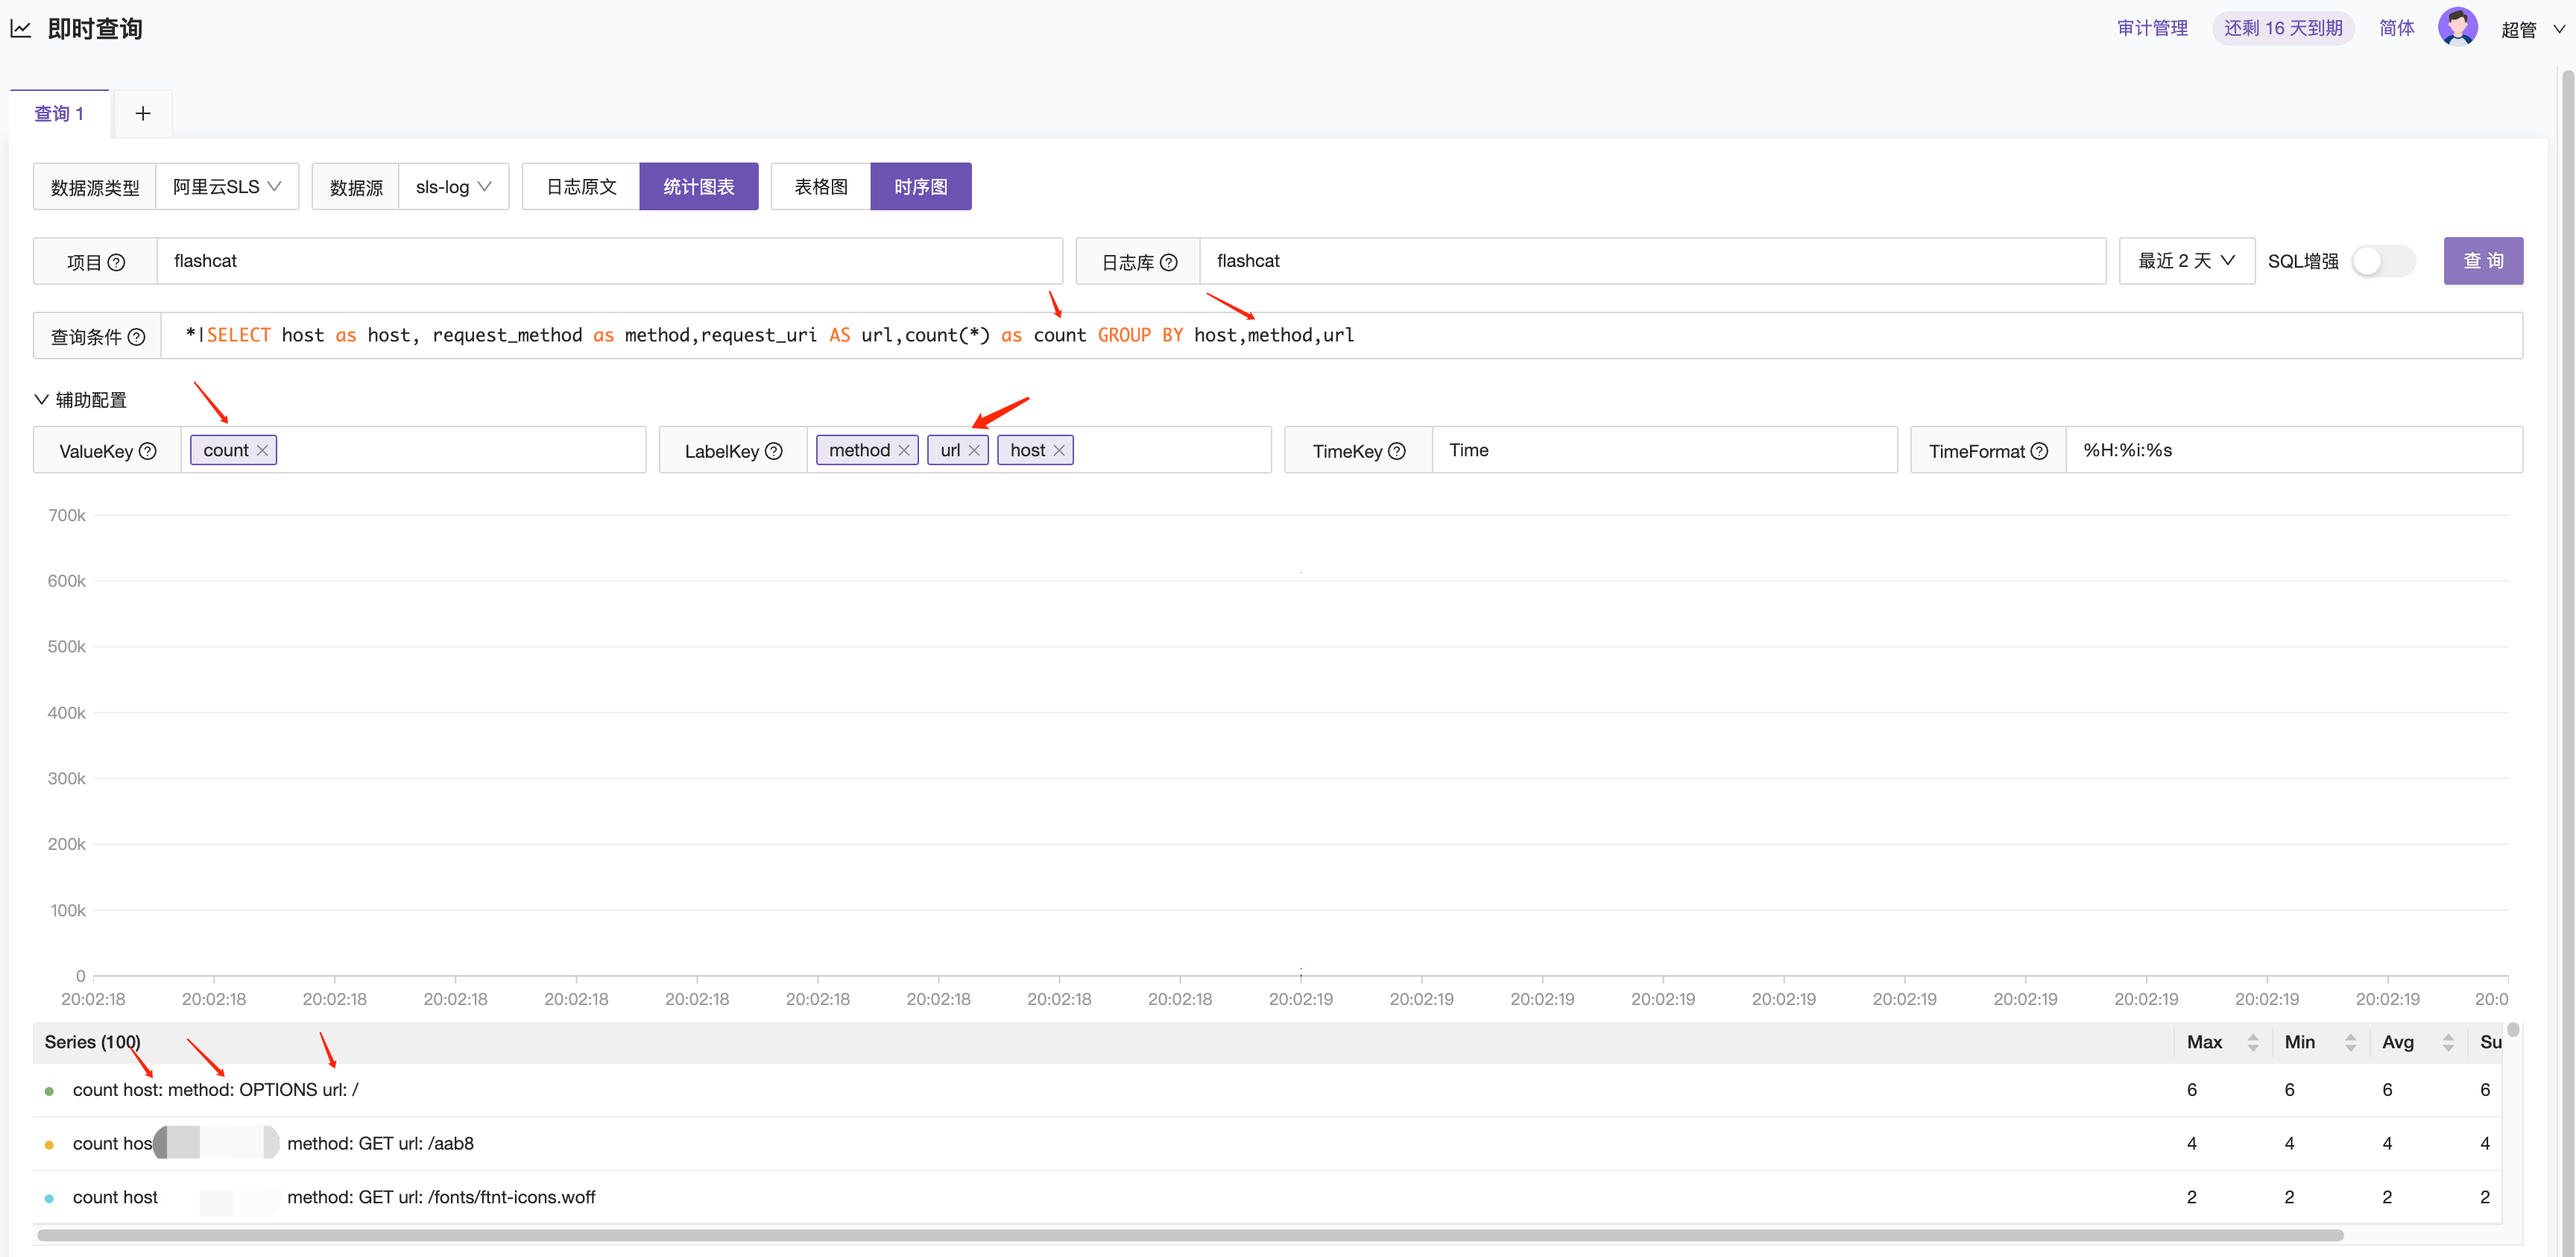
Time-Series Chart
The Alibaba Cloud SLS log query results can be extracted as values, and the filtering conditions are stored as tags in the metrics. Here are some query examples to learn and understand.
Common Basic Query Syntax
Query logs where GET requests are successful (status codes 200~299) and request time is less than 60 seconds:
request_method:GET and status in [200 299] not request_time>=60
Query logs where the remote_user field is not empty: not remote_user:""
Query logs where the remote_user field is empty: remote_user:""
Query logs where the remote_user field is not null: not remote_user:"null"
Query logs where the remote_user field does not exist: not remote_user:*
Query logs where the remote_user field exists: remote_user:*
Query logs where the host field value is not 123: not host:123.*
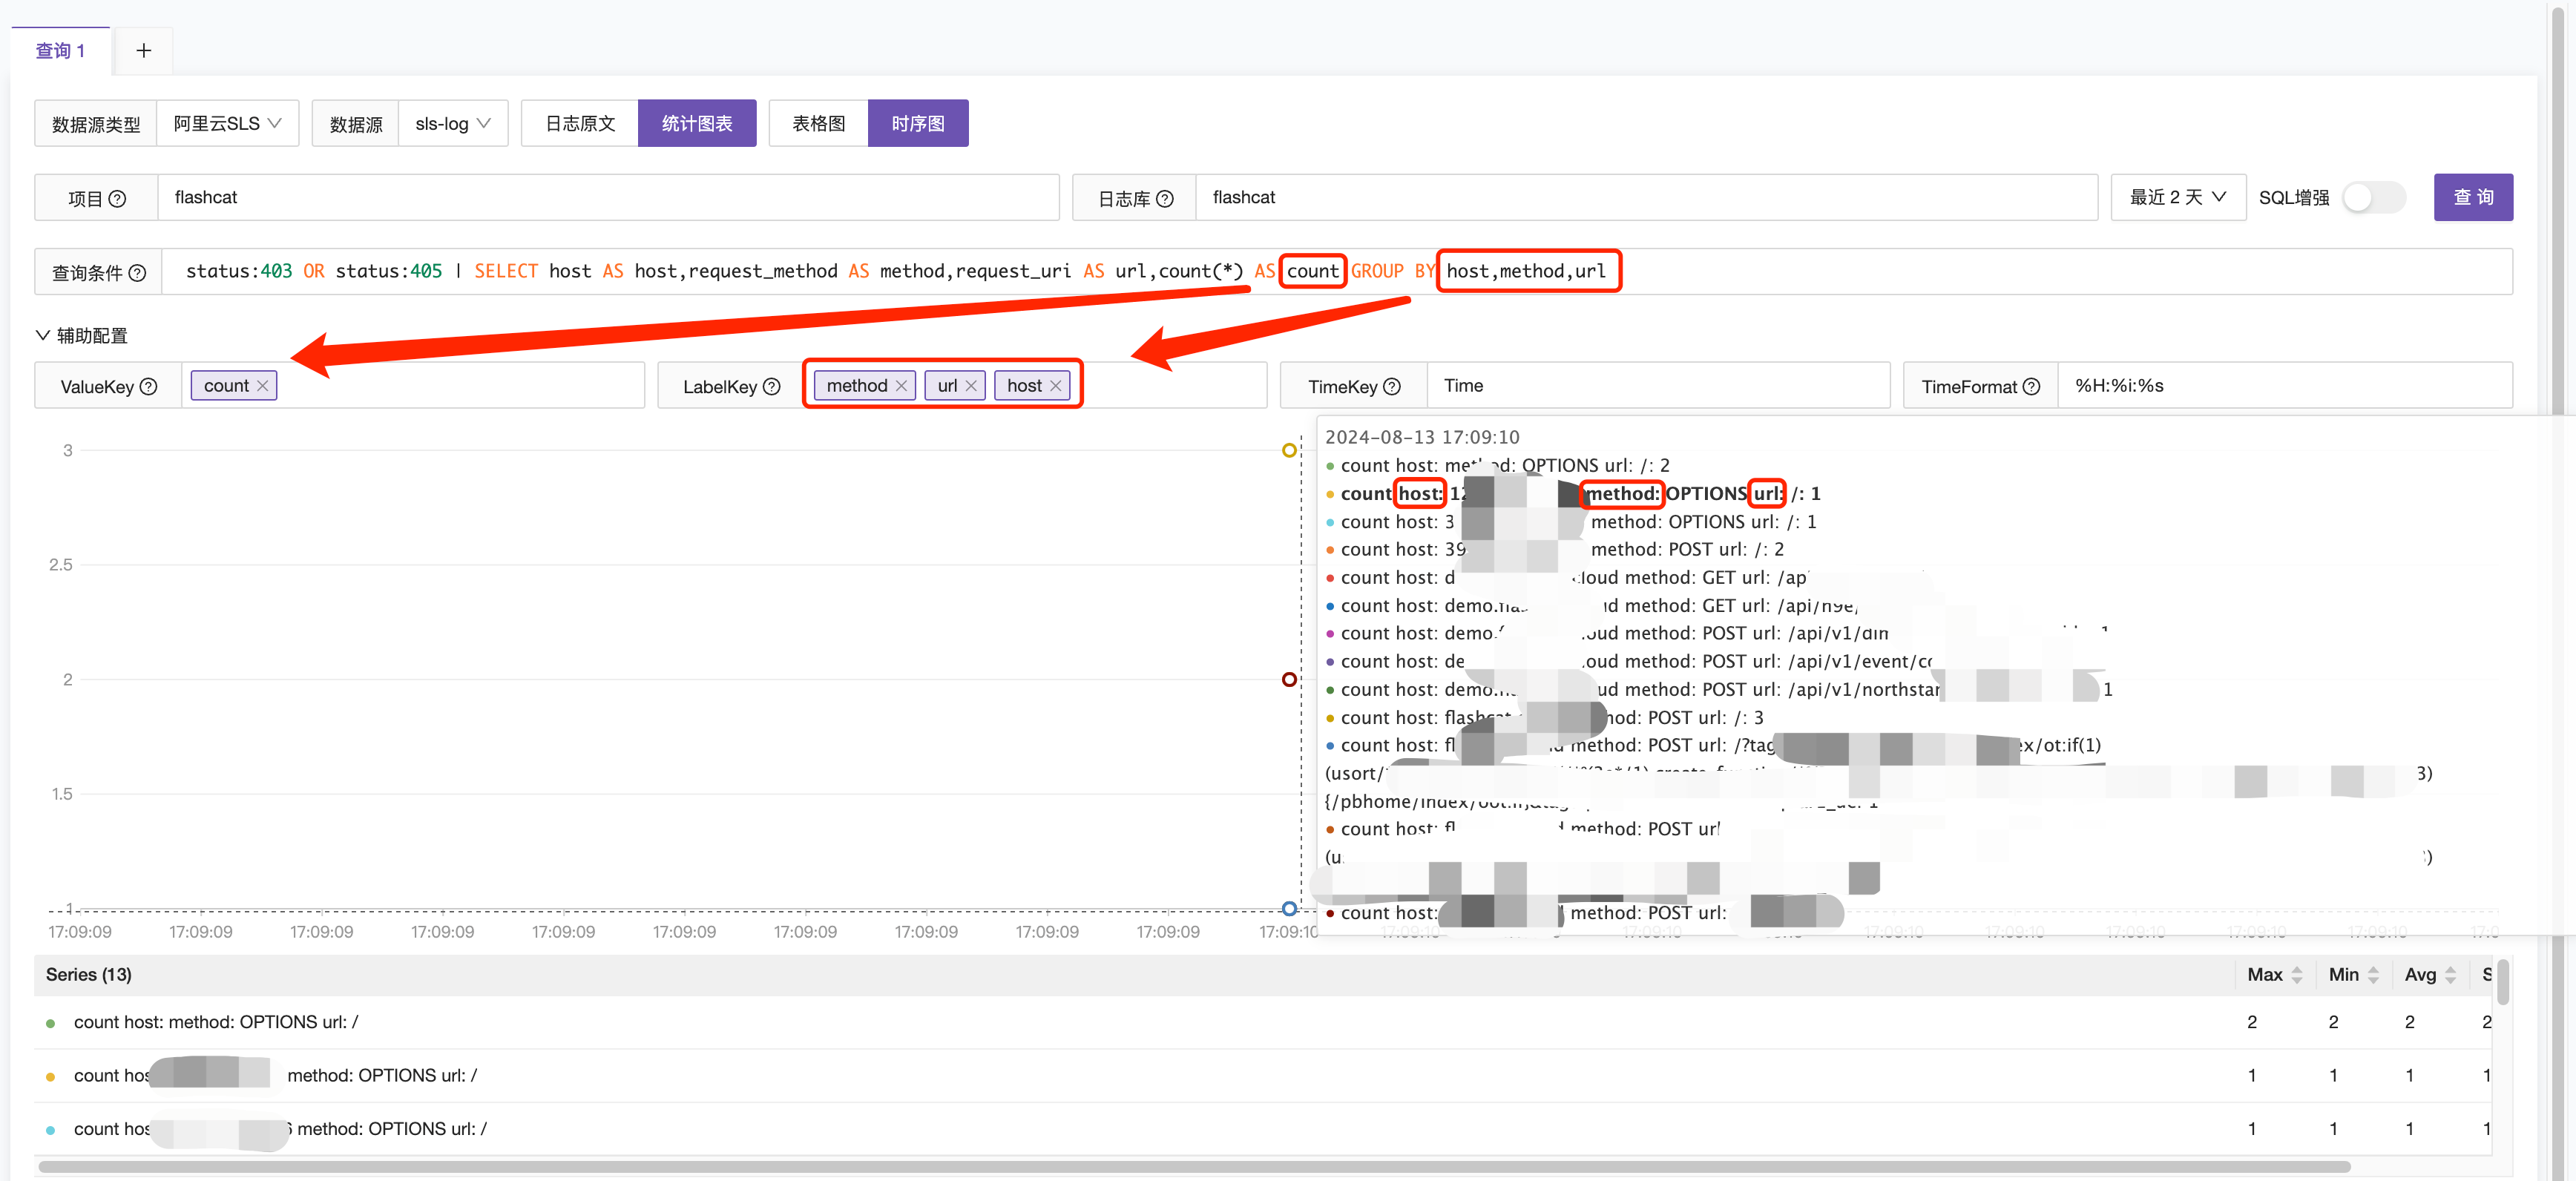
Scenario 1: Query proxy logs with status codes 403 and 405, grouped by host, method, and request_uri.
status:403 OR status:405 | SELECT host AS host,request_method AS method,request_uri AS url,count(*) AS count GROUP BY host,method,url
This query can also be transformed into an error log query, for example: errCode: xxx or errCode:xxx | select ...
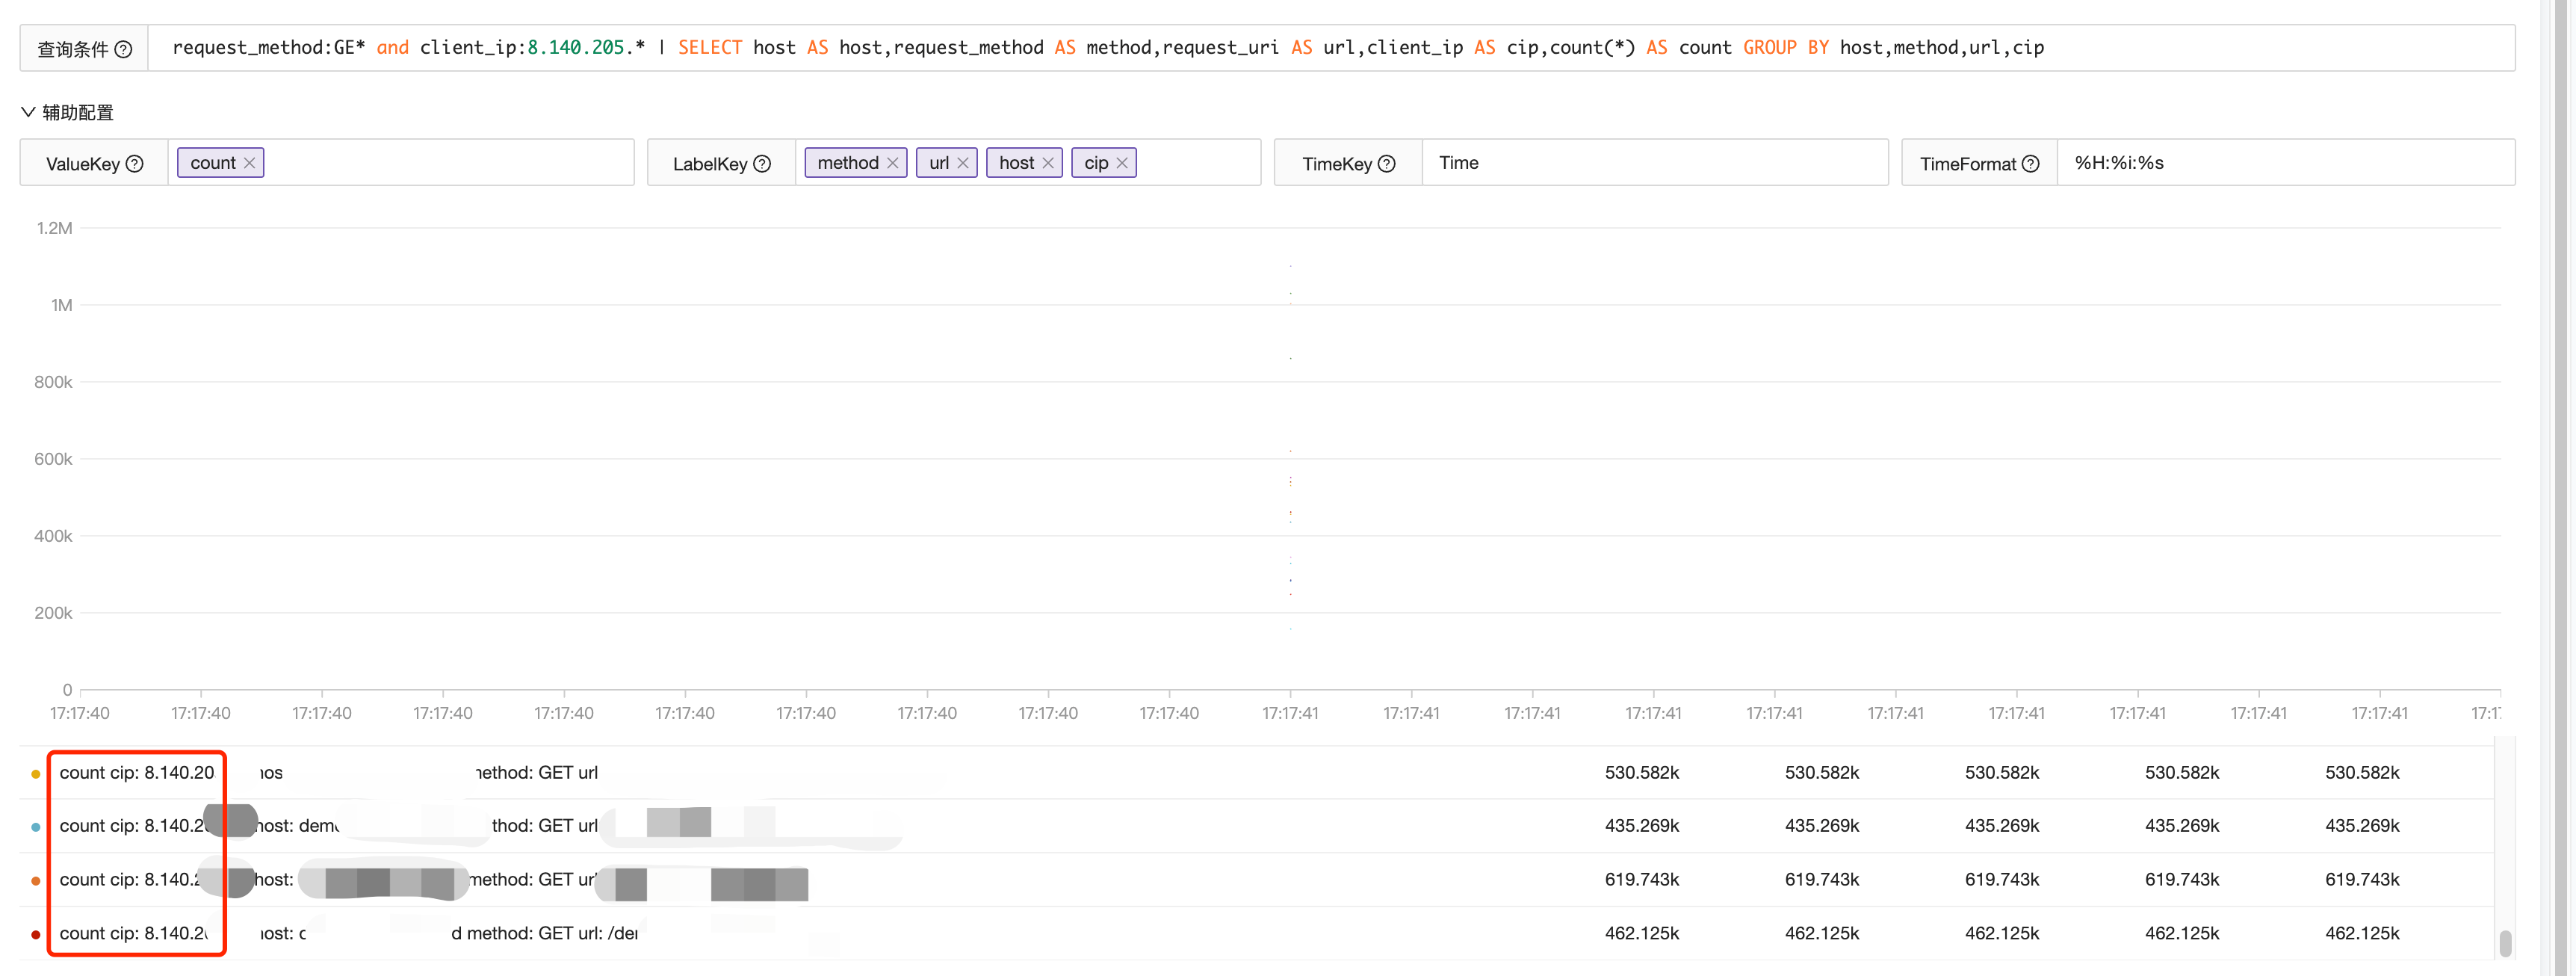
Scenario 2: Query logs where the request_method field starts with GE and the client_ip field range is 8.140.205.*, grouped by host, method, and request_uri.
request_method:GE* and client_ip:8.140.205.* | SELECT host AS host,request_method AS method,request_uri AS url,client_ip AS cip,count(*) AS count GROUP BY host,method,url,cip
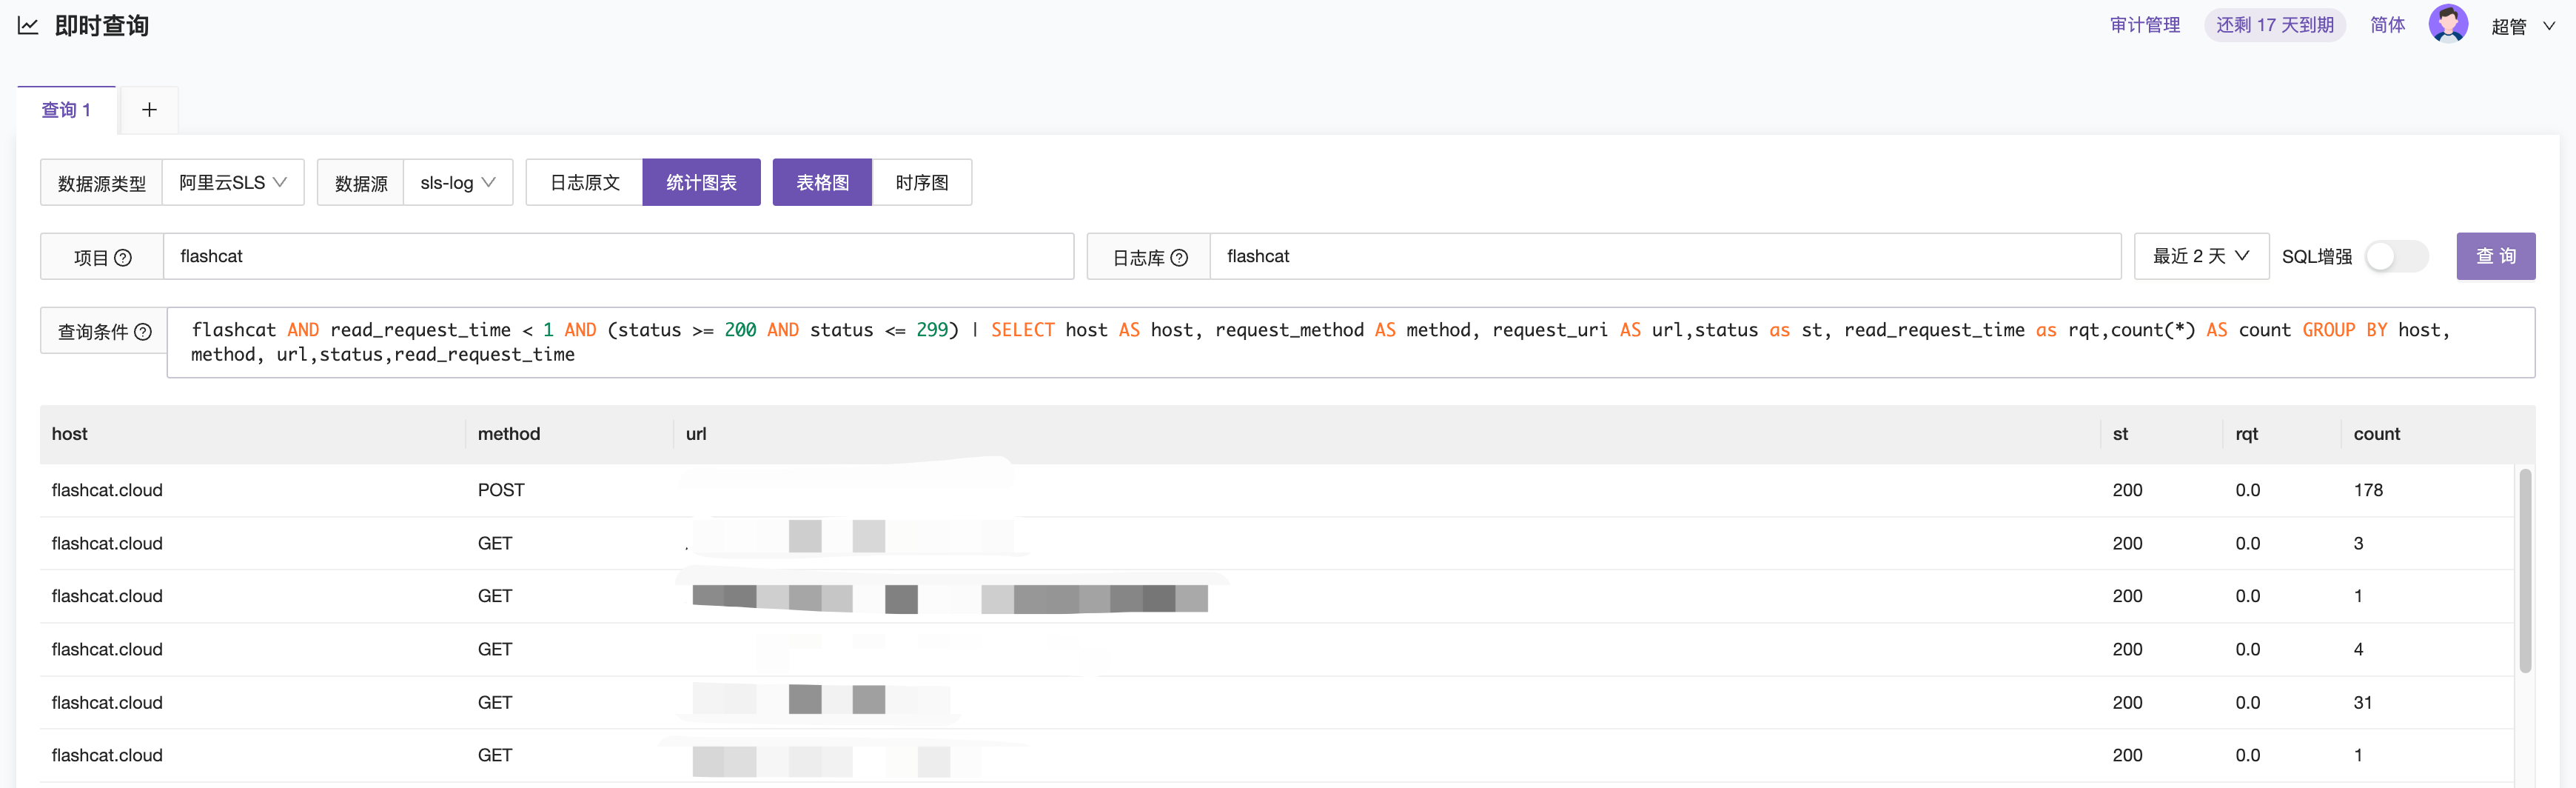
Scenario 3: Query logs where successful requests with a request time of less than 1 second contain the string “flashcat”, grouped by host, method, request_uri, status, and request_uri.
flashcat AND read_request_time < 1 AND (status >= 200 AND status <= 299) | SELECT host AS host, request_method AS method, request_uri AS url,status as st, read_request_time as rqt,count(*) AS A GROUP BY host, method, url,status,read_request_time
Scenario 4: Query proxy logs from yesterday with status codes 403 and 405, grouped by host, method, and request_uri.
status:403 OR status:405 | SELECT host AS host, request_method AS method, request_uri AS url, from_unixtime(__time__) AS time, count(*) AS A WHERE __time__ < to_unixtime(current_date) AND __time__ > to_unixtime(date_add('day', -1, current_date)) GROUP BY host, method, url, time
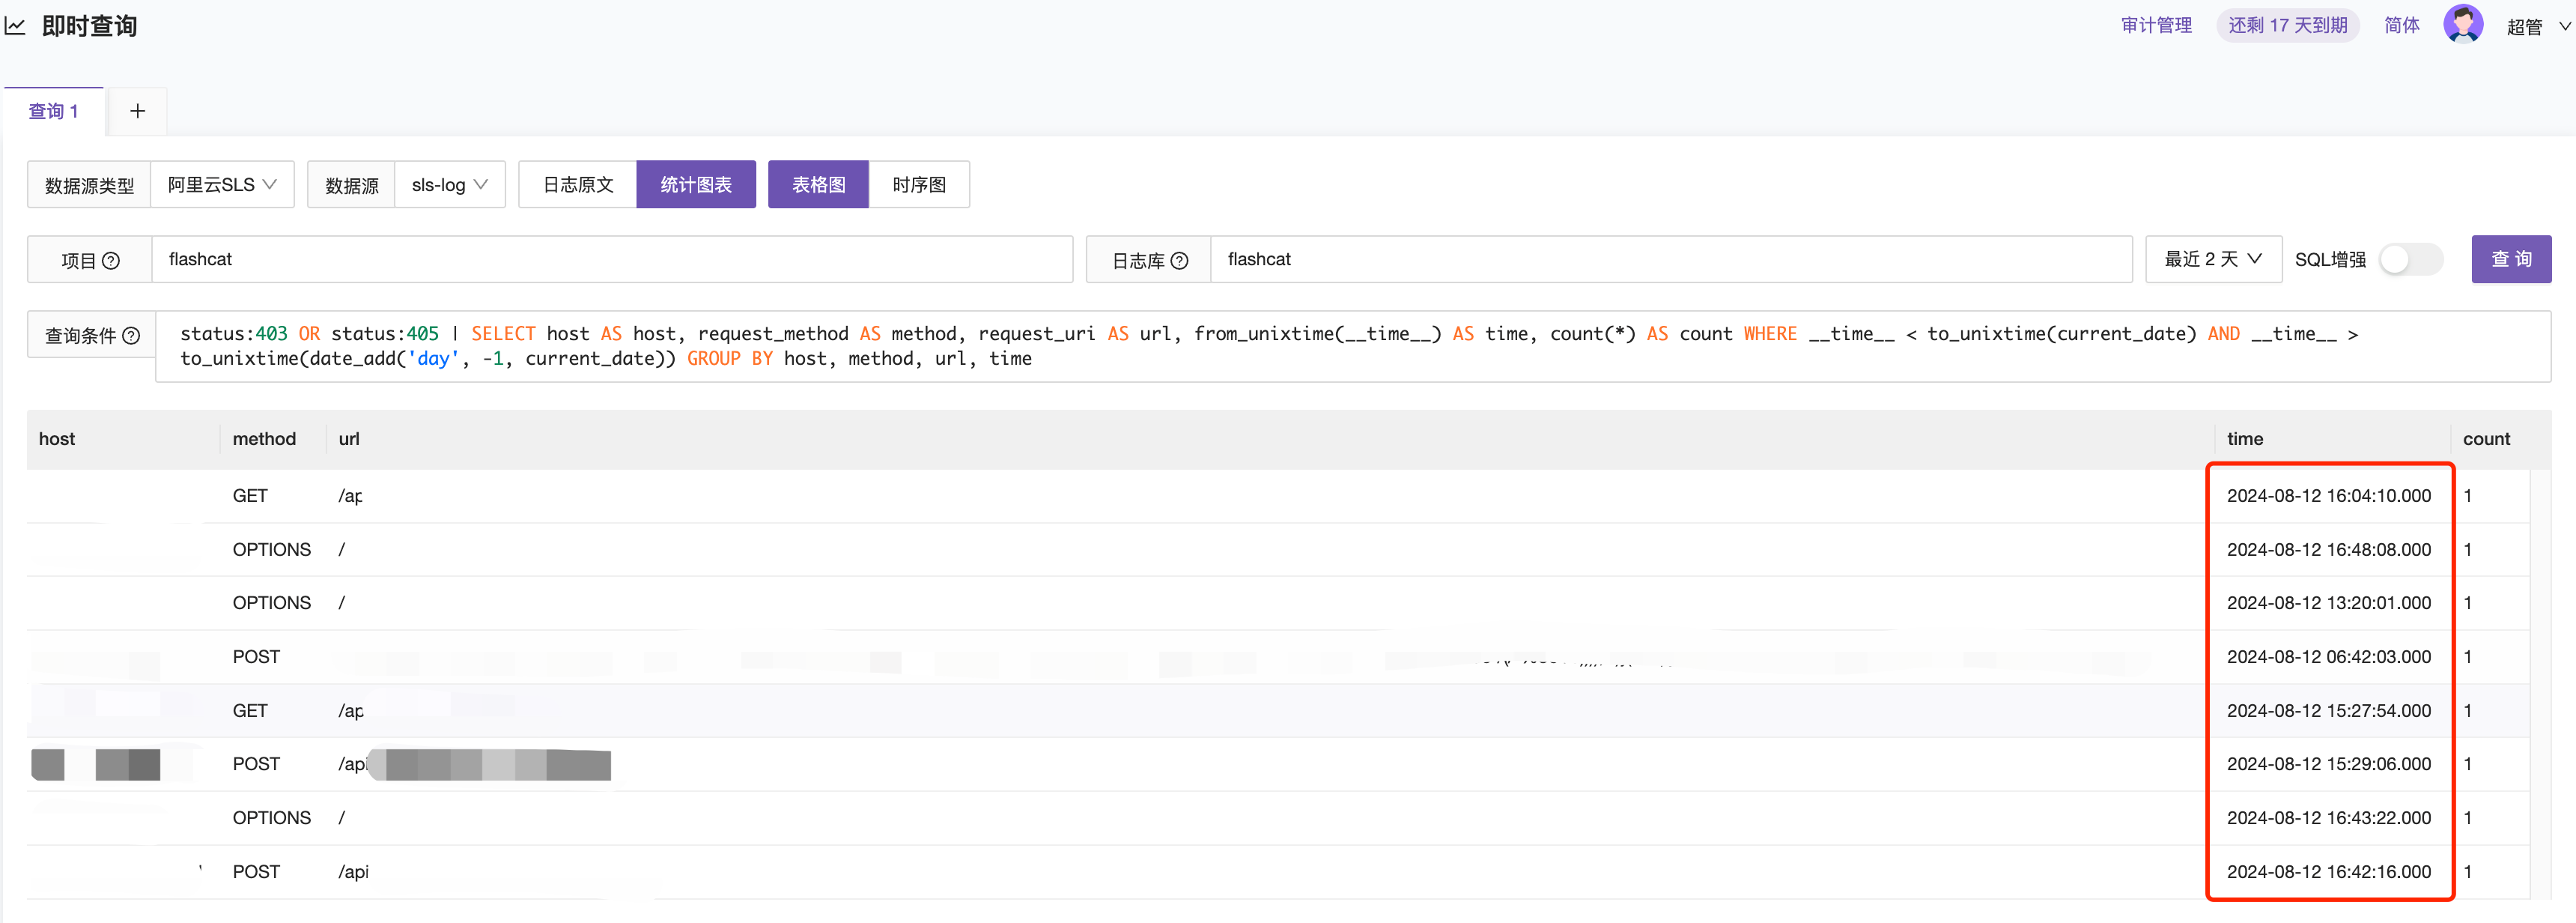
This query mainly uses the from_unixtime(), to_unixtime(), current_date, date_add, and day functions.
from_unixtime function: Converts a UNIX timestamp to a timestamp type date and time expression in the format YYYY-MM-DD HH:MM:SS.Ms or YYYY-MM-DD HH:MM:SS.Ms Time_zone.
to_unixtime function: Converts a timestamp type date and time expression to a UNIX timestamp.
current_date function: Returns the current date in the format YYYY-MM-DD.
date_add function: Adds or subtracts a specified time interval to a date or time.
day function: Extracts the day from a date and time expression, calculated by month. The day function is equivalent to the day_of_month function.
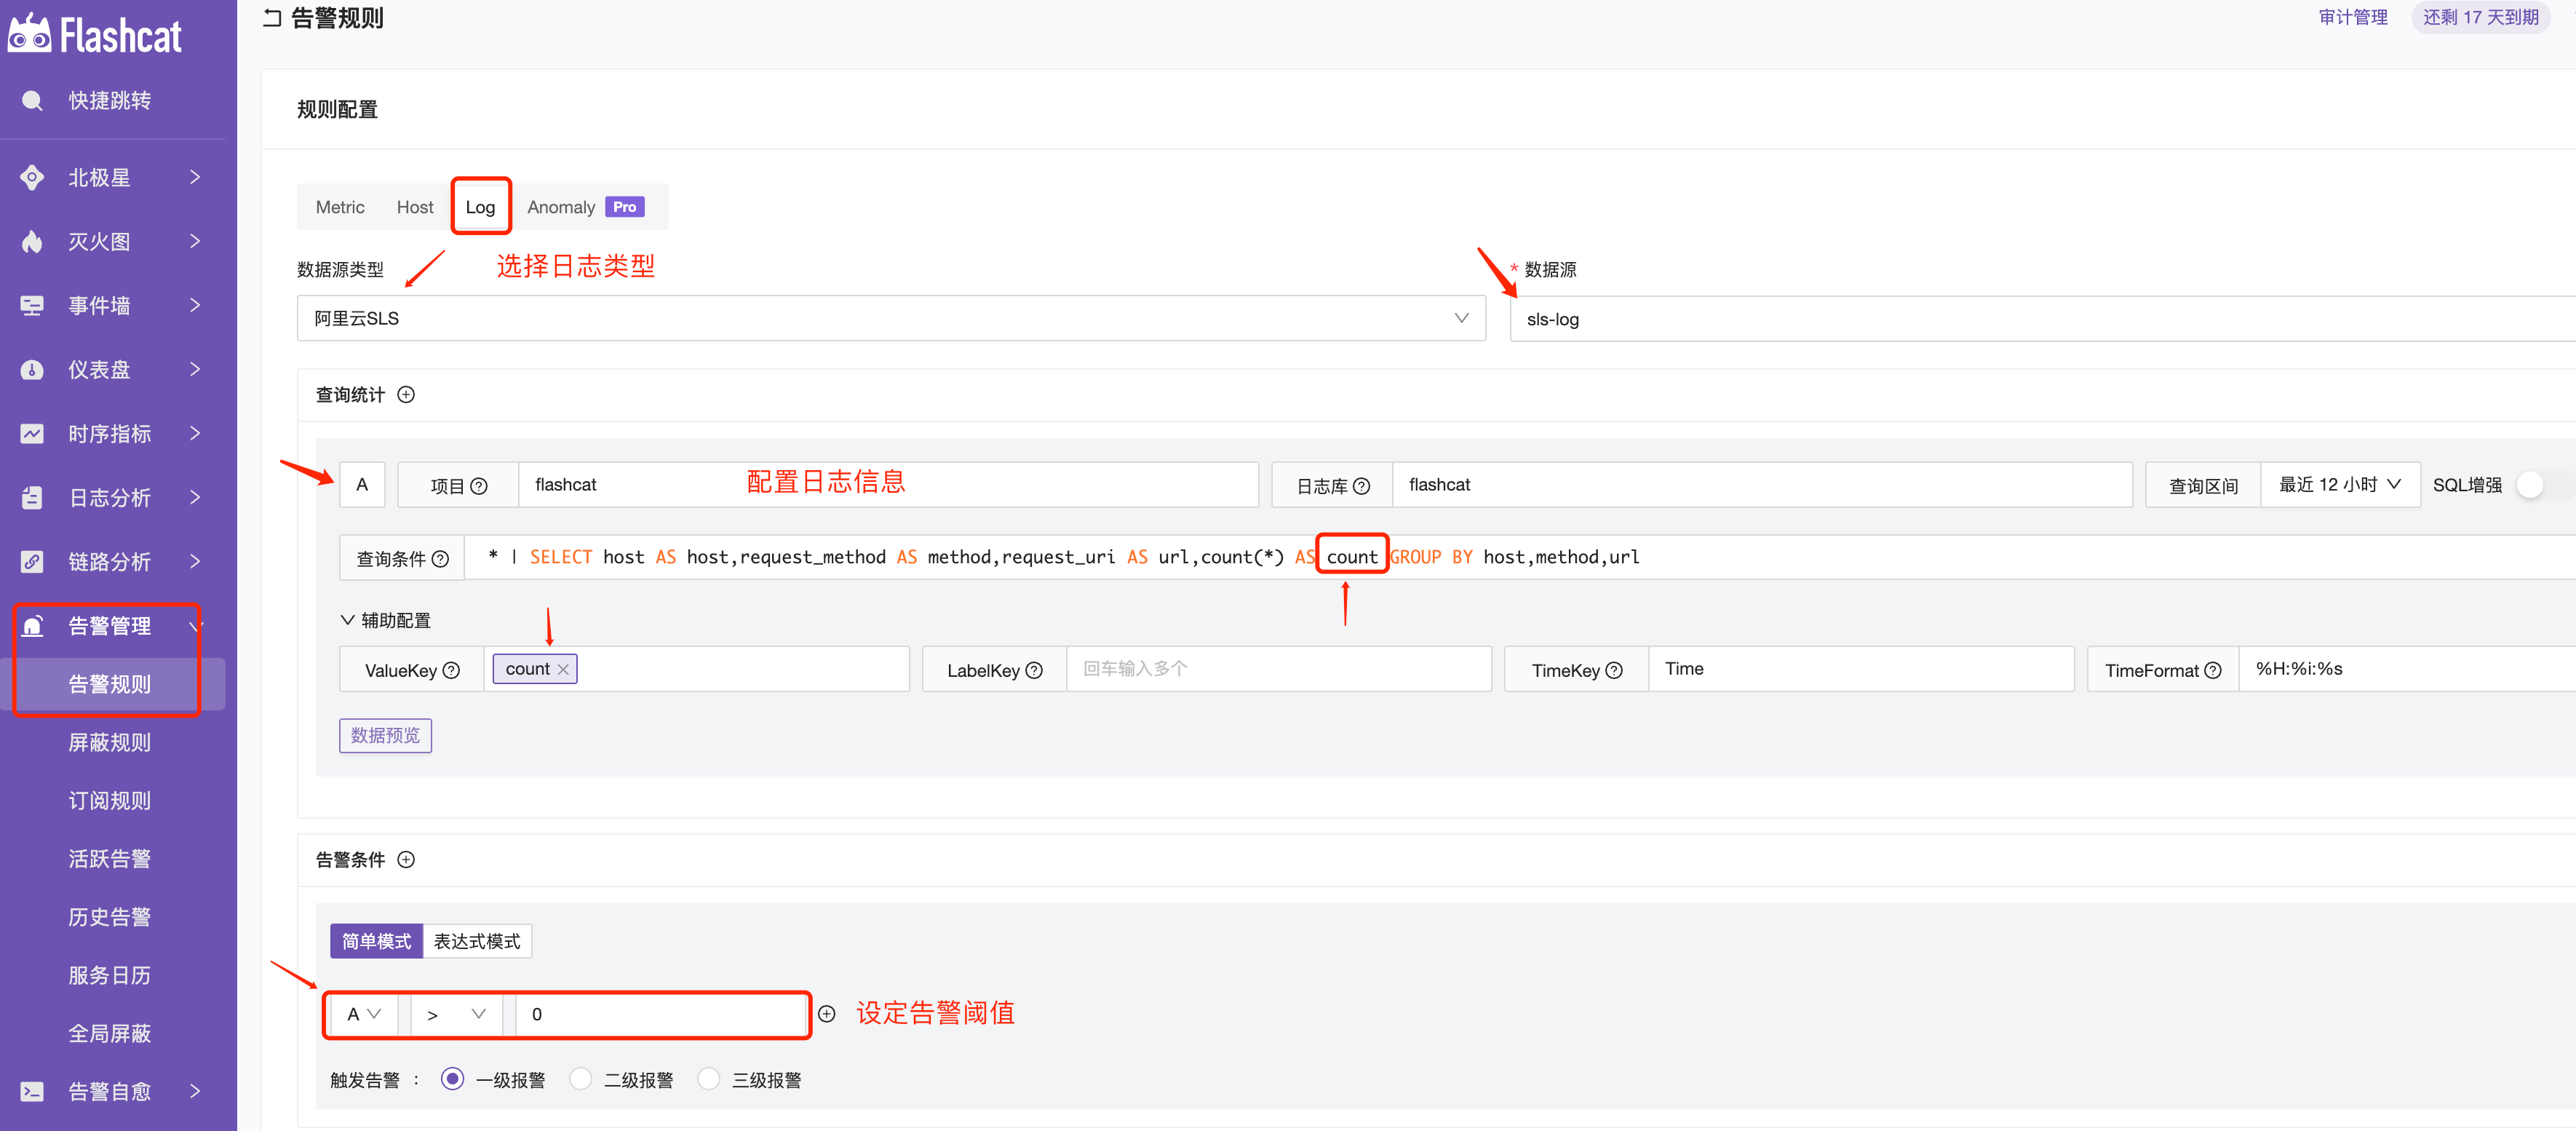
SLS Log Alarms
In alarm rules —> select log data source —> configure query statement and extract ValueKey —> select simple mode to set the threshold for ValueKey within a specified time.
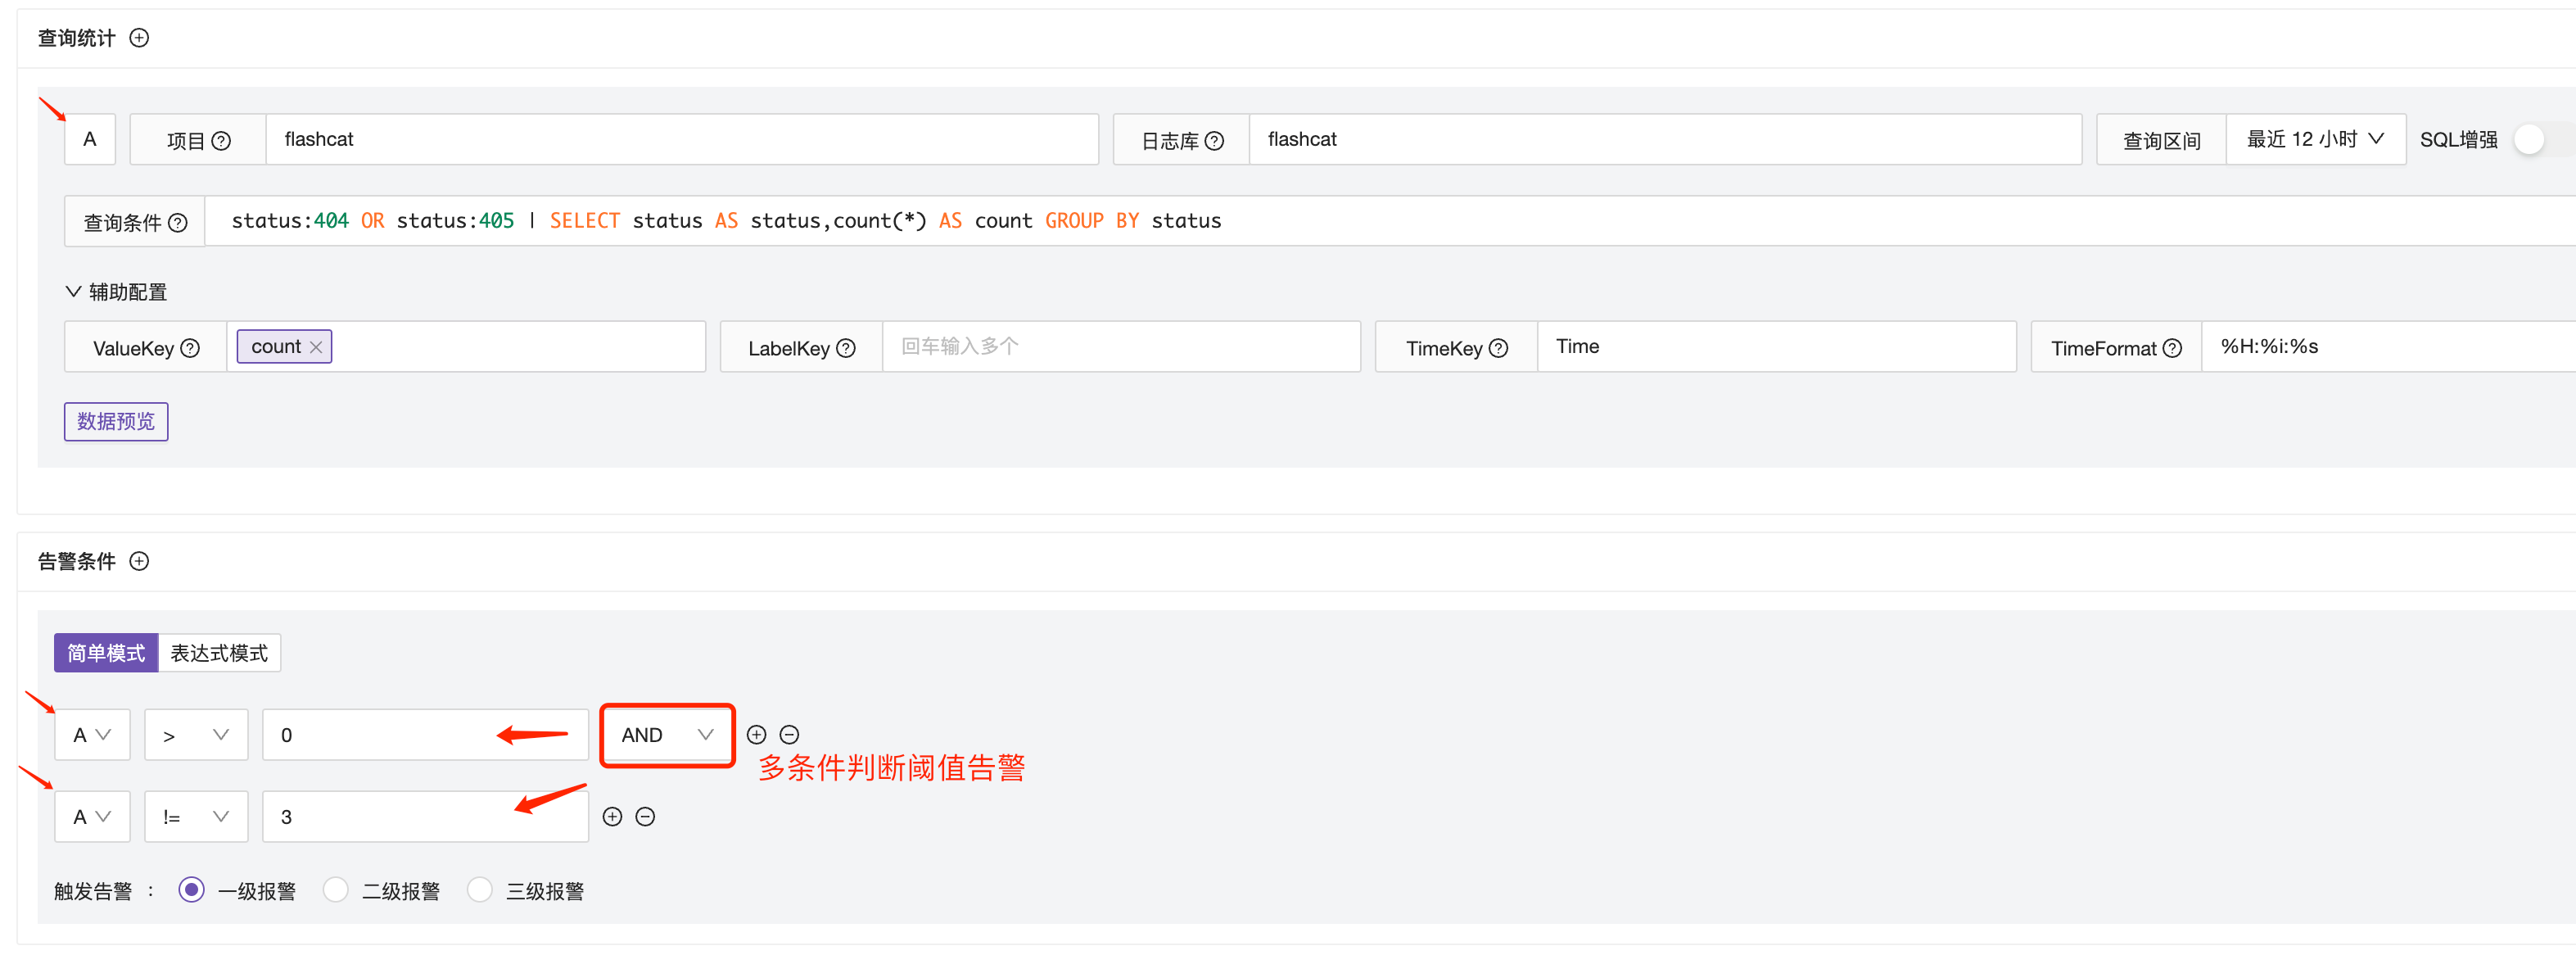
Configuration Scenario 1: Query the number of logs with status codes 404 and 405 in the proxy logs, and alarm if the query result is greater than 0 and not equal to 3.
The query statement is the query syntax introduced above: status:404 OR status:405 | SELECT status AS status,count(*) AS count GROUP BY status. This is a condition judgment based on the query result, so in the condition judgment, $A > 0 and $A !=3 are used.
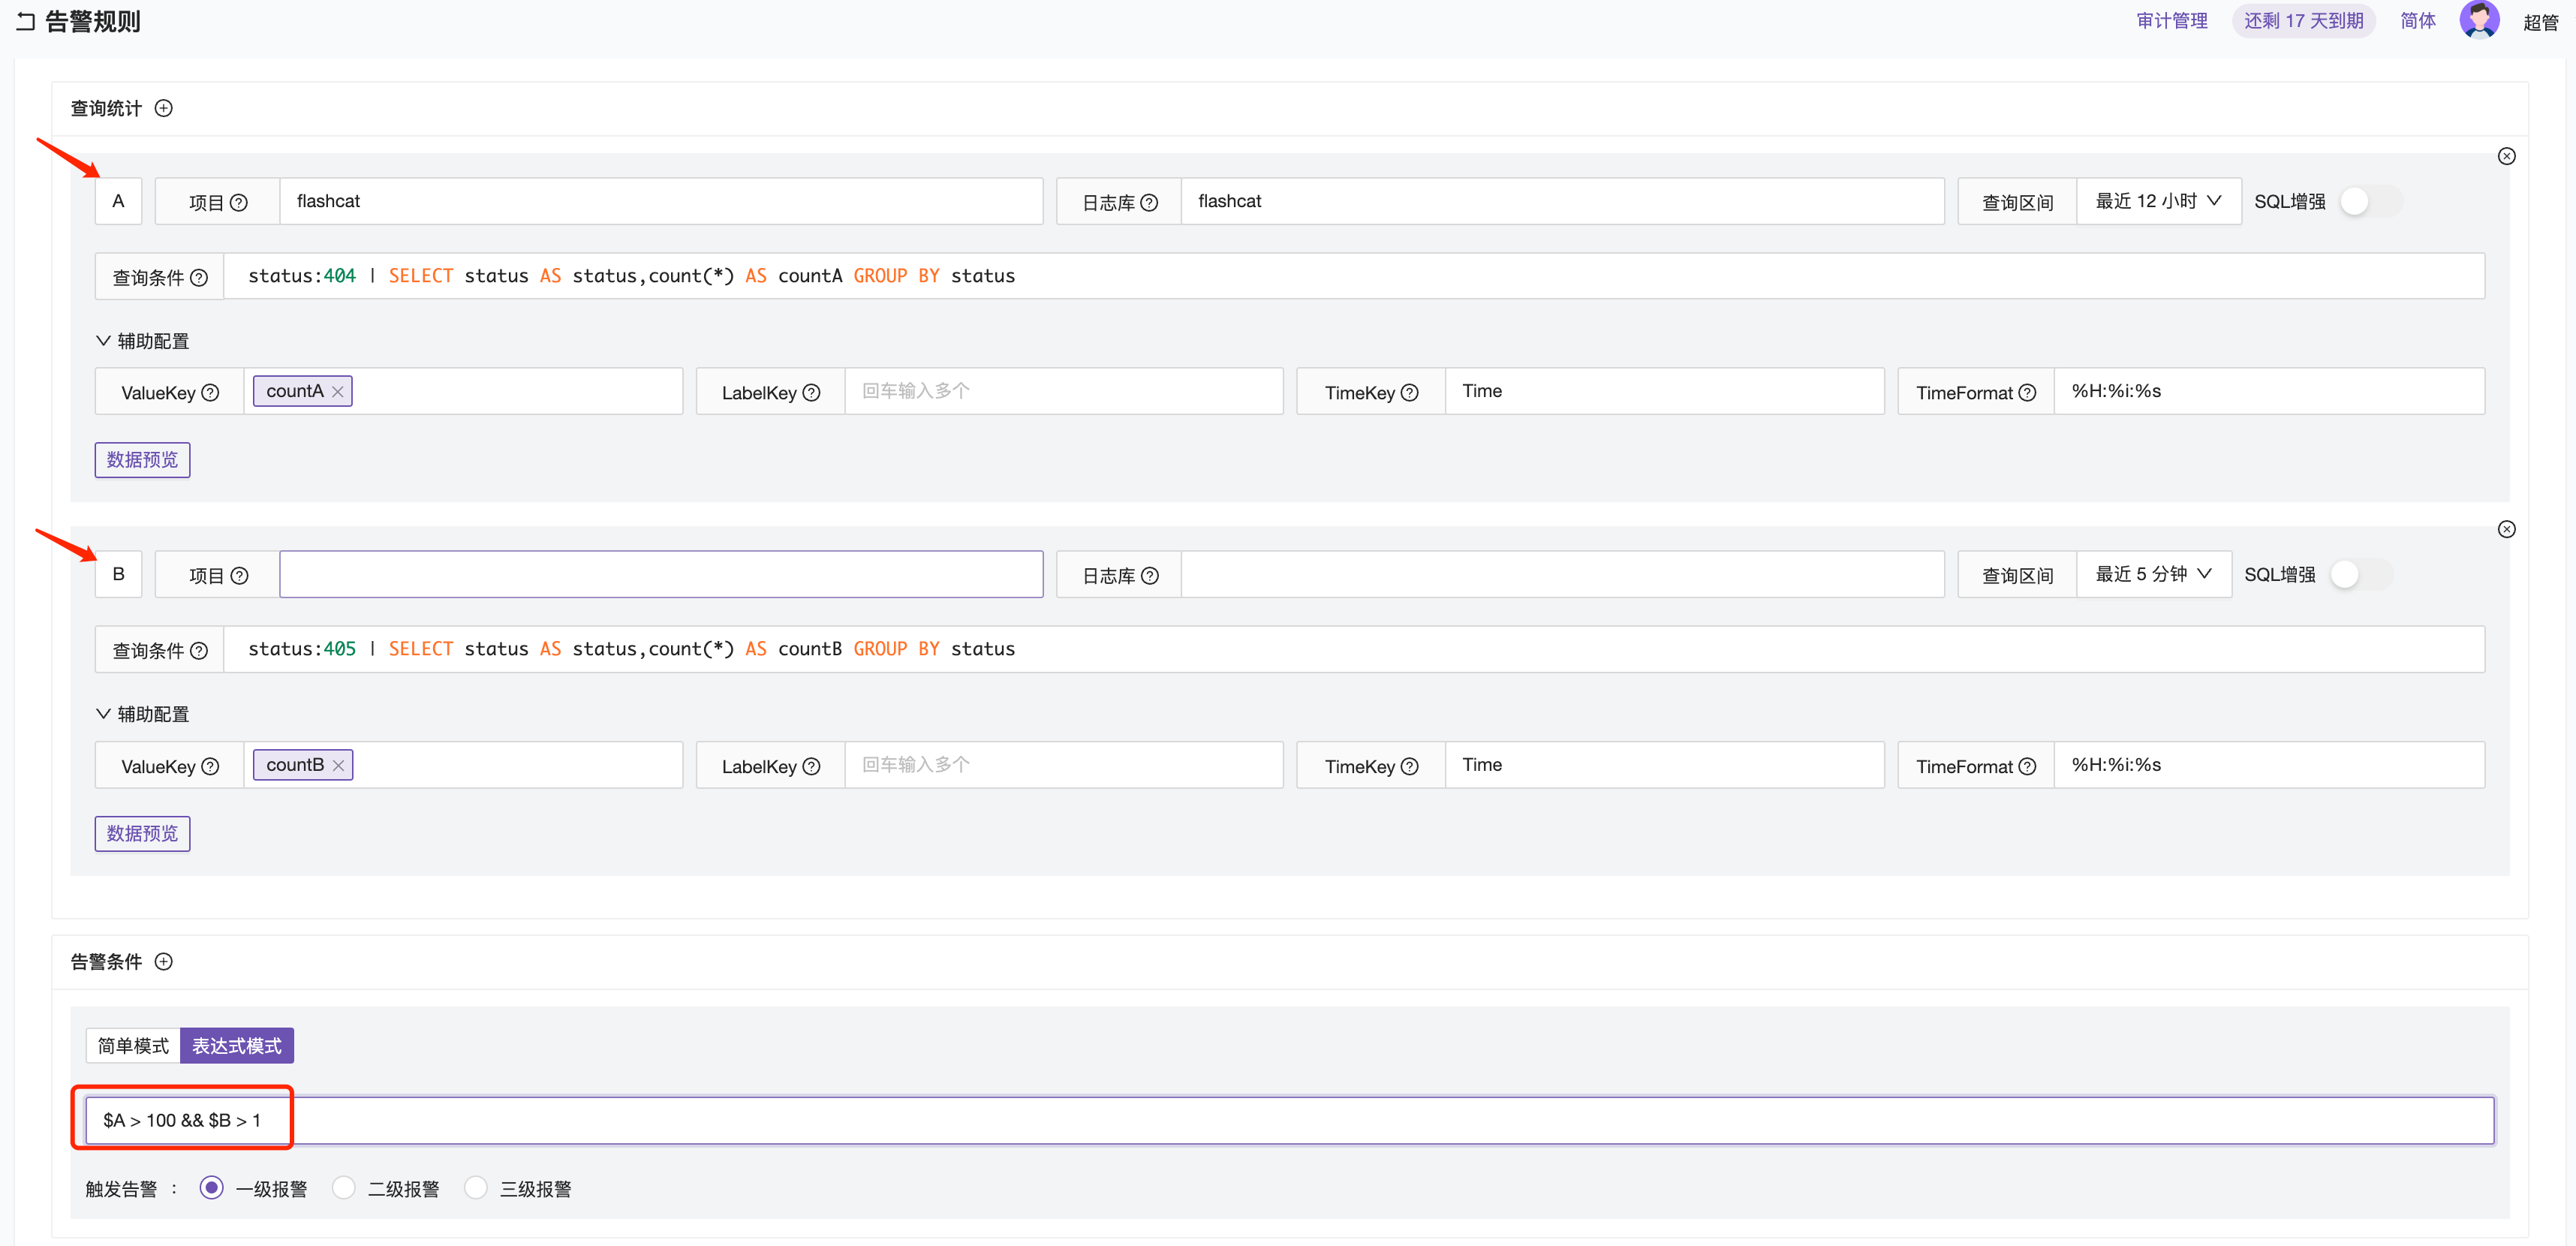
Configuration Scenario 2: Configure different metrics for result judgment, triggering an alarm if status:404 value is greater than 100 and status:405 value is greater than 1.
To achieve the combined judgment of different query values, you need to write two different query analysis statements, extract the values for judgment, and use the extracted values $A and $B for comparison operations.
Note:
- Similar to PromQL, if the data labels are inconsistent, the query analysis statements will be regarded as two different curves and cannot be compared. In this case, do not set the LabelKey to ensure that the data curves will not be unable to operate due to different labels.
- Currently, only “equal to” numerical values are supported, and “equal to” strings are not supported. Therefore, to filter strings, you need to include the string in the query statement.
SLS Dashboard
If you want to use the data from the Alibaba Cloud SLS log source as a chart, you can create a dashboard in the chart panel, configure the chart according to the query results, and support statistical charts, time series, and other forms of display.

If your data results are displayable and queryable, you can refer to the above methods for operation.
This completes the basic configuration of SLS data connection, query, and alarm.


