MySQL Data Source Configuration Fields
There are many ways to install MySQL available online, so this document will not cover those in detail. Instead, it will directly introduce how to connect MySQL as a data source.
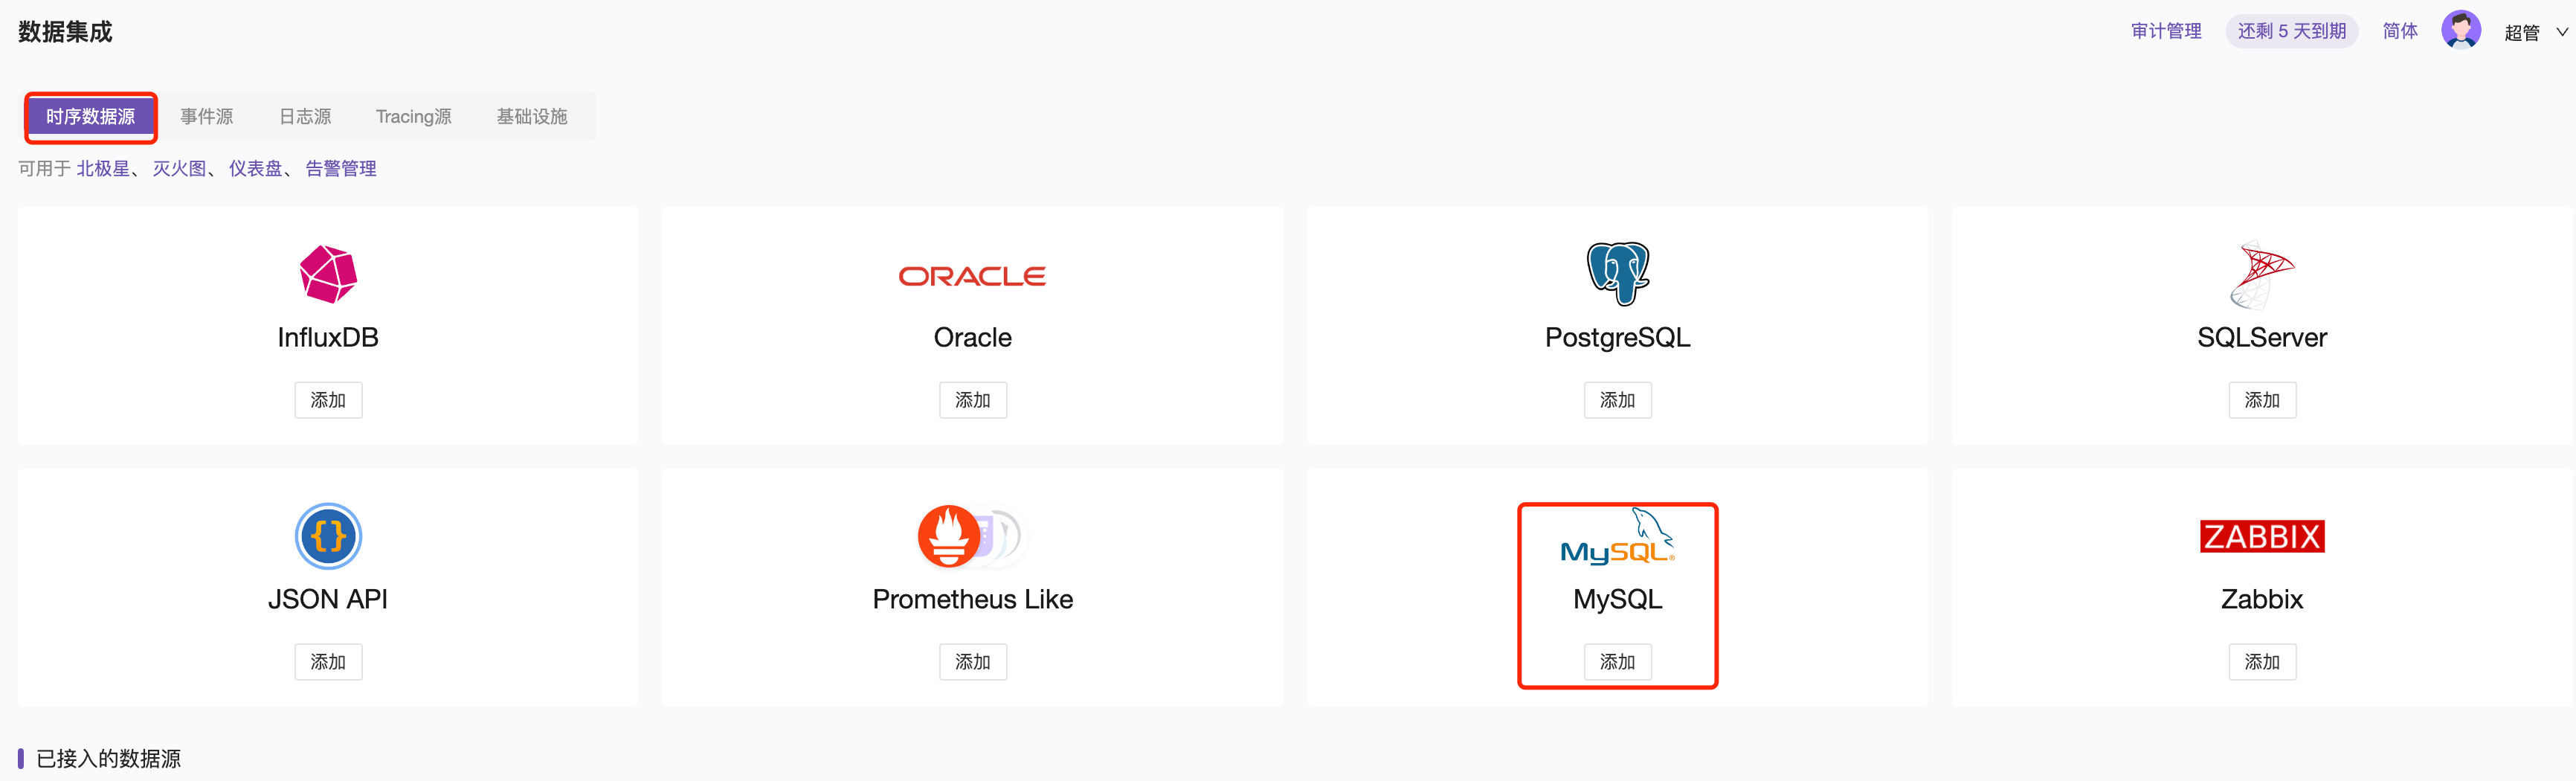
In Data Integration — Select Time Series Data Source — Select MySQL
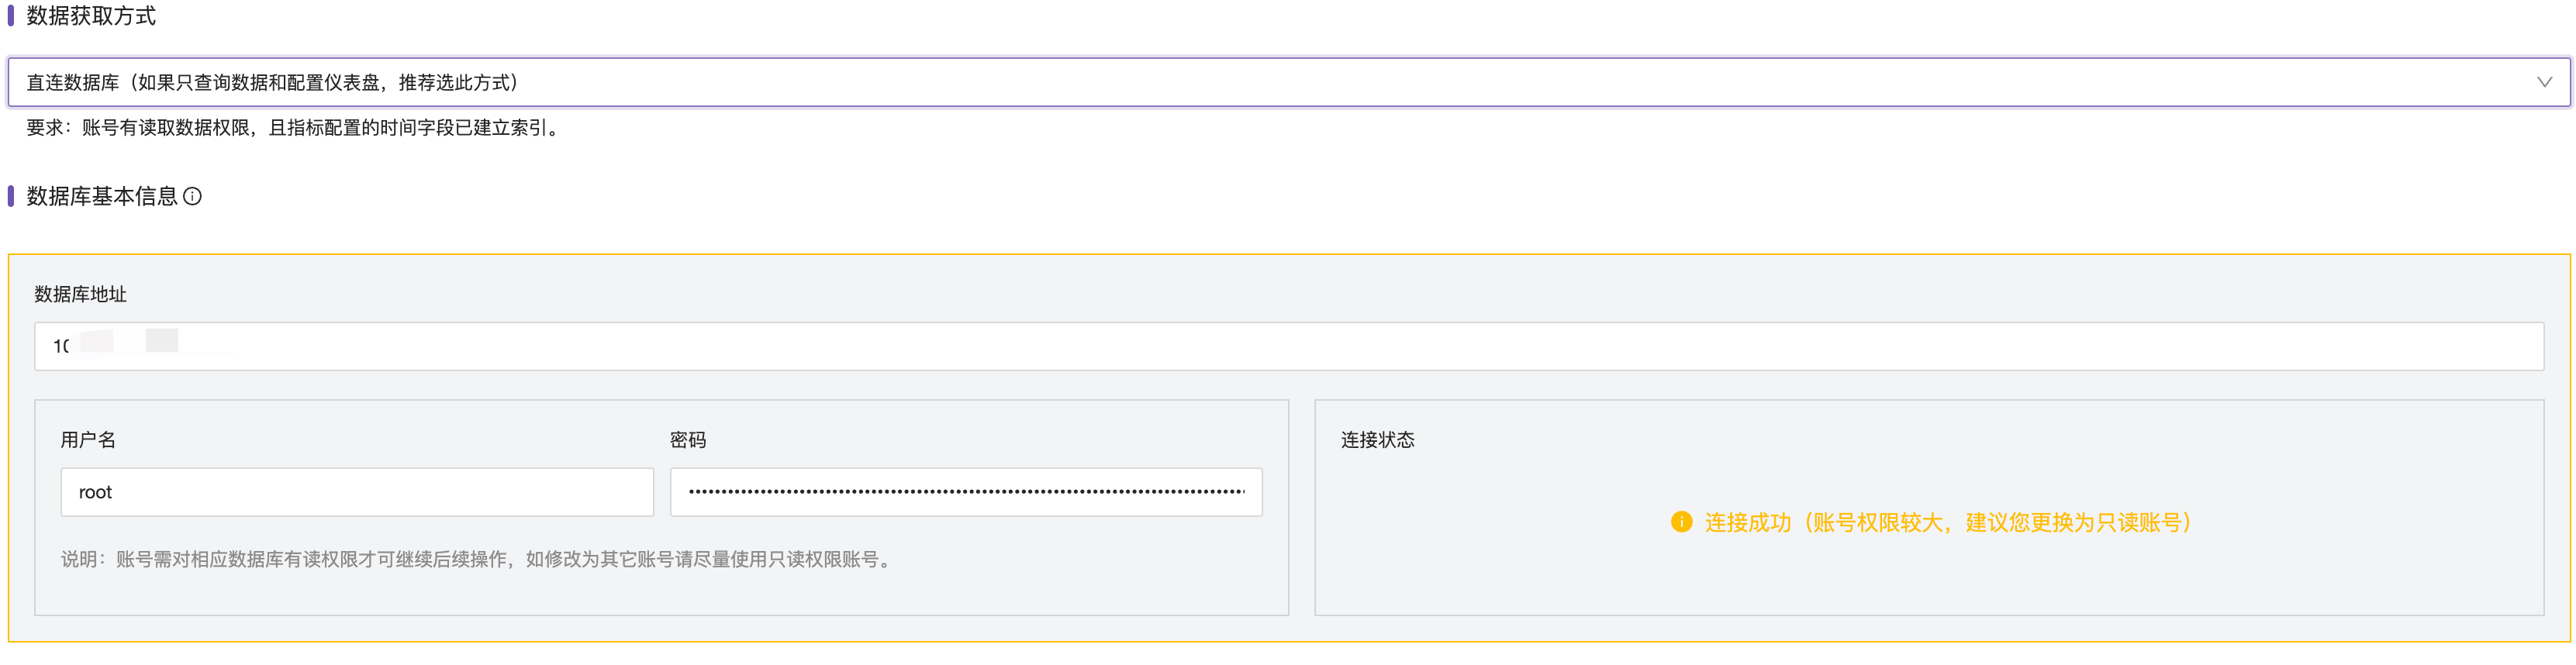
MySQL configuration only requires configuring the connection address, username, password, and associating with the alert engine.
Query Data
In Time Series Metrics - Instant Query, select the data source type MySQL, enter the SQL statement in the query conditions, and the corresponding results will be queried. Click the prompt icon next to the query conditions to view the MySQL documentation.

Configure Alerts
To configure alert rules, add a new alert rule. The core configuration parameters are introduced below.
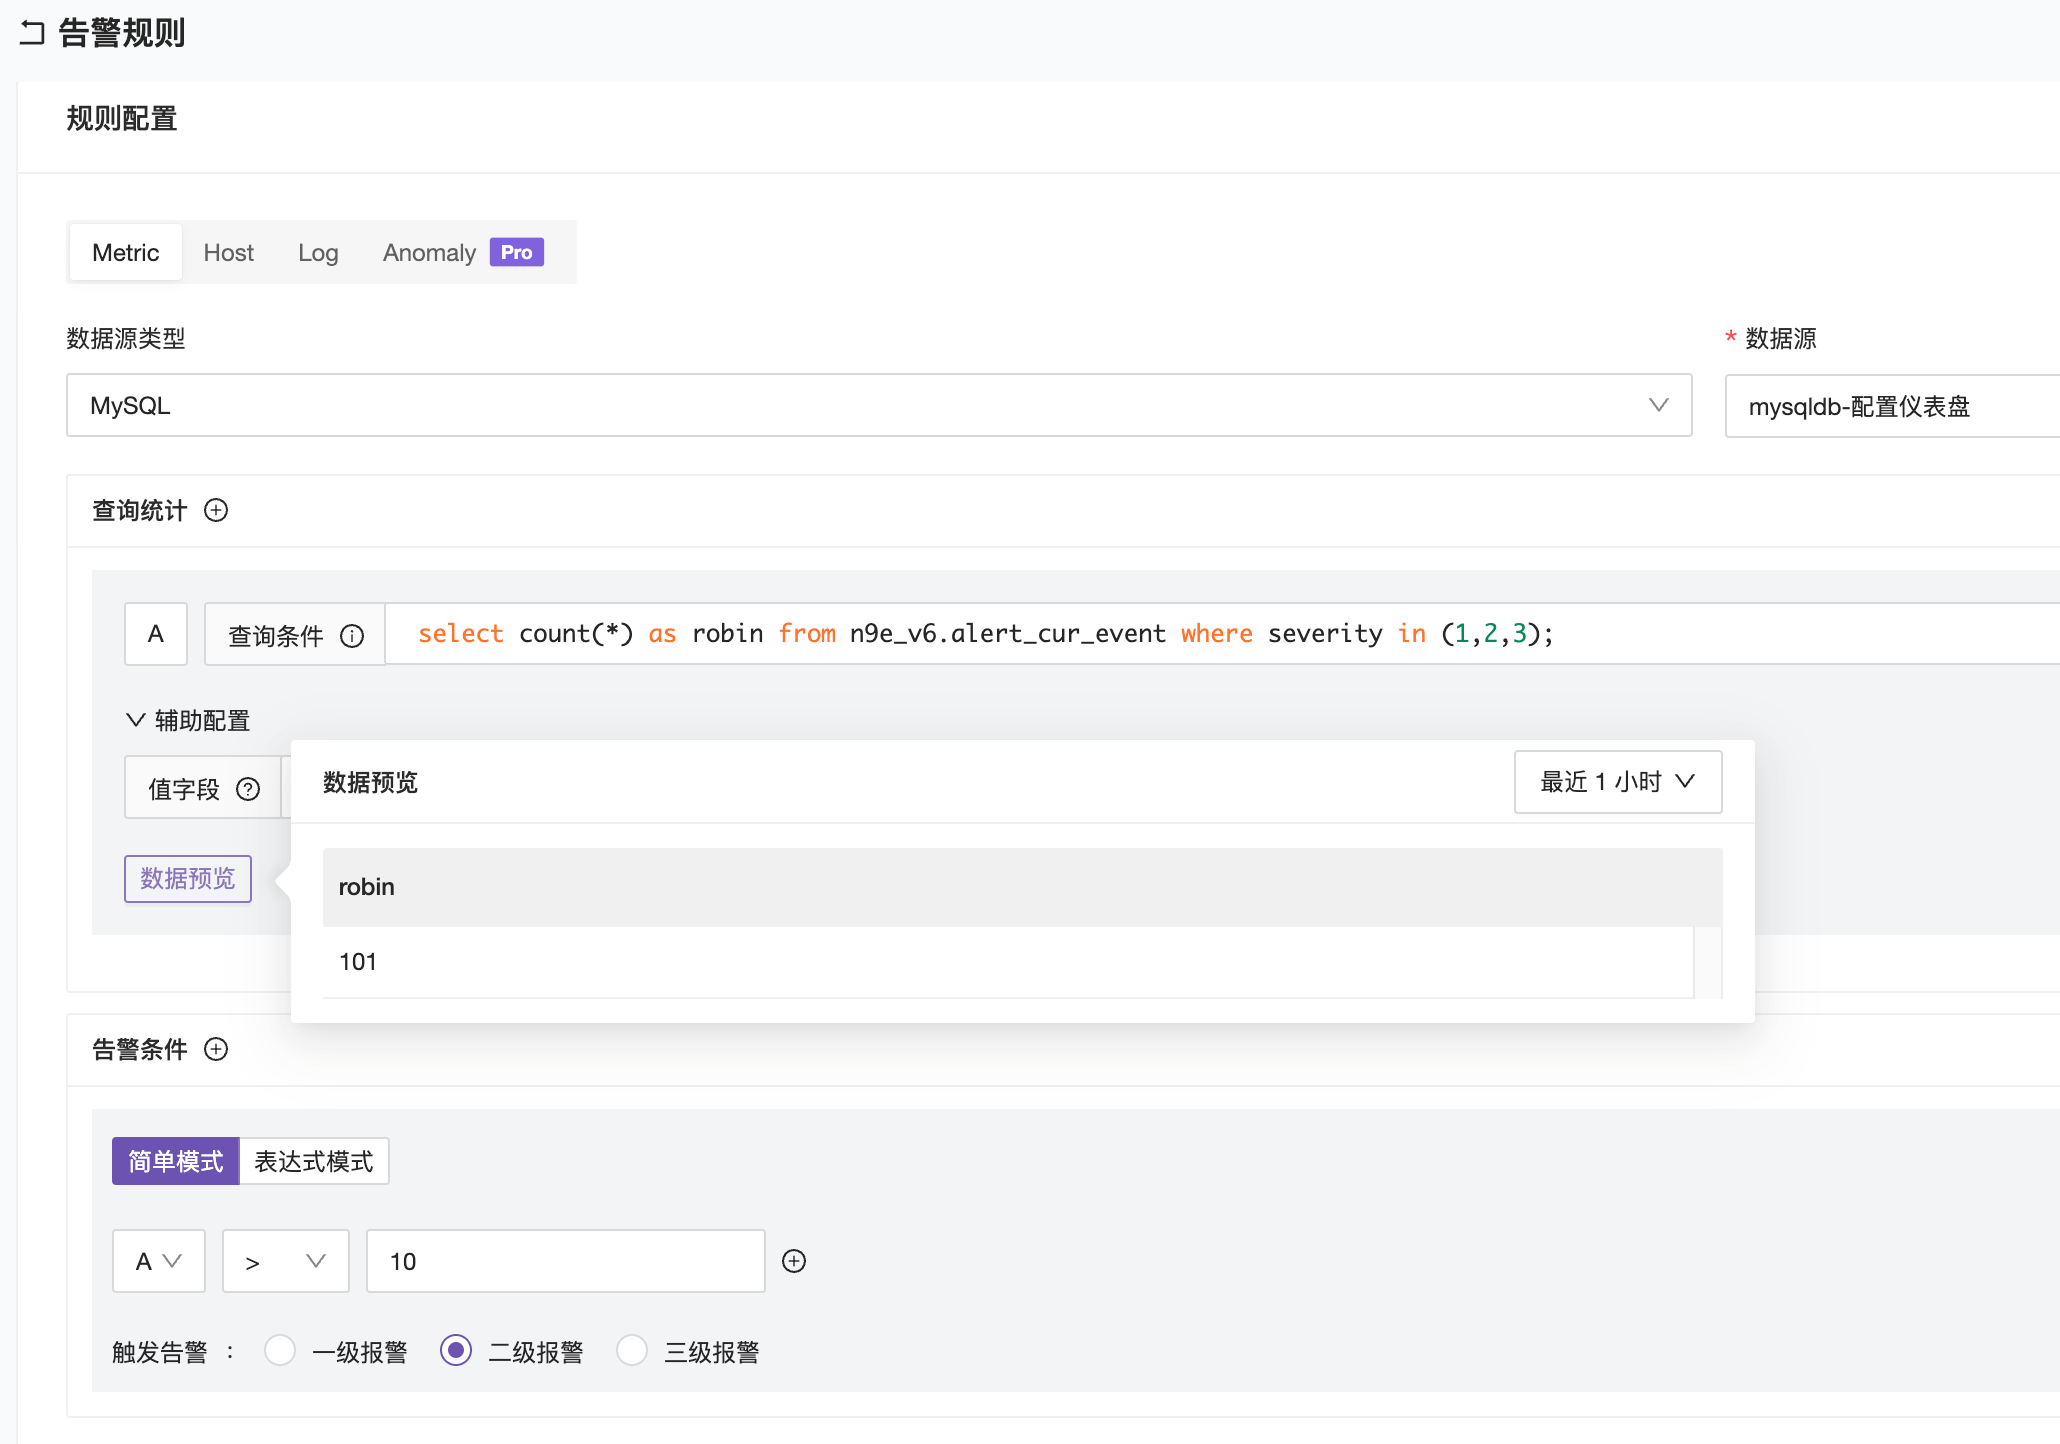
Data Source Type: Select MySQL;
Data Source: Select the configured MySQL data source;
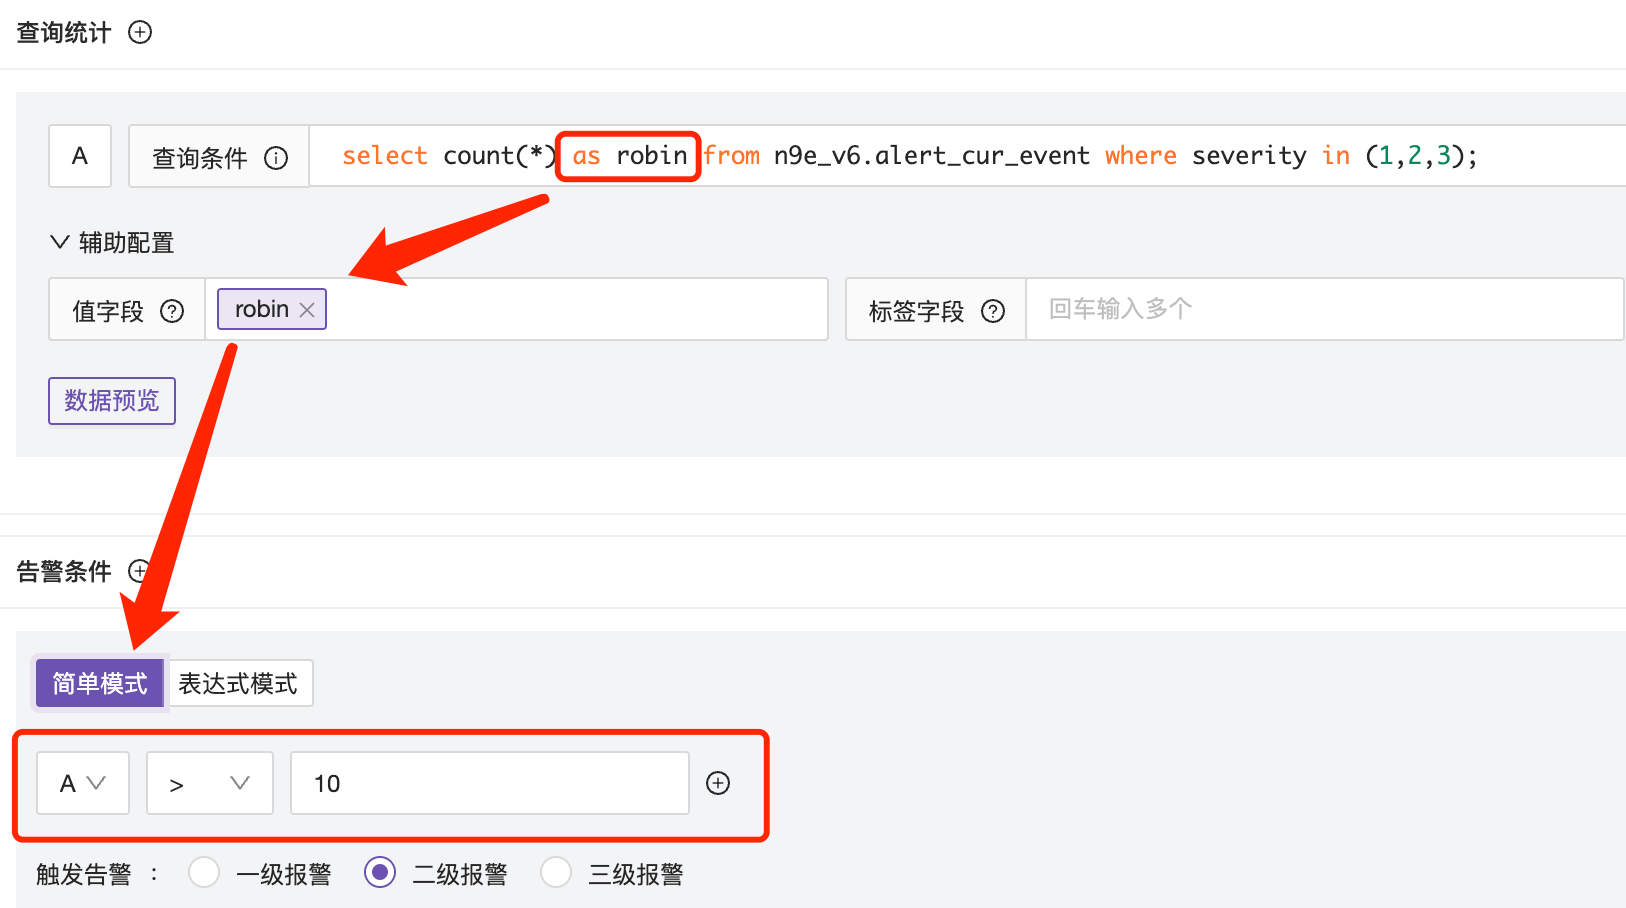
Query Condition: The query alert statement, similar to the role of the PromQL expression;
Value Field: The core required field, SQL query results usually contain multiple columns, you can specify which column values are displayed on the chart as curves.
Alert Conditions:
Set the threshold for the alert query condition to trigger.
● Simple Mode
The result of the query statement is stored in $A, and the threshold is set using $A. As shown below, the final trigger threshold uses $A > 10.
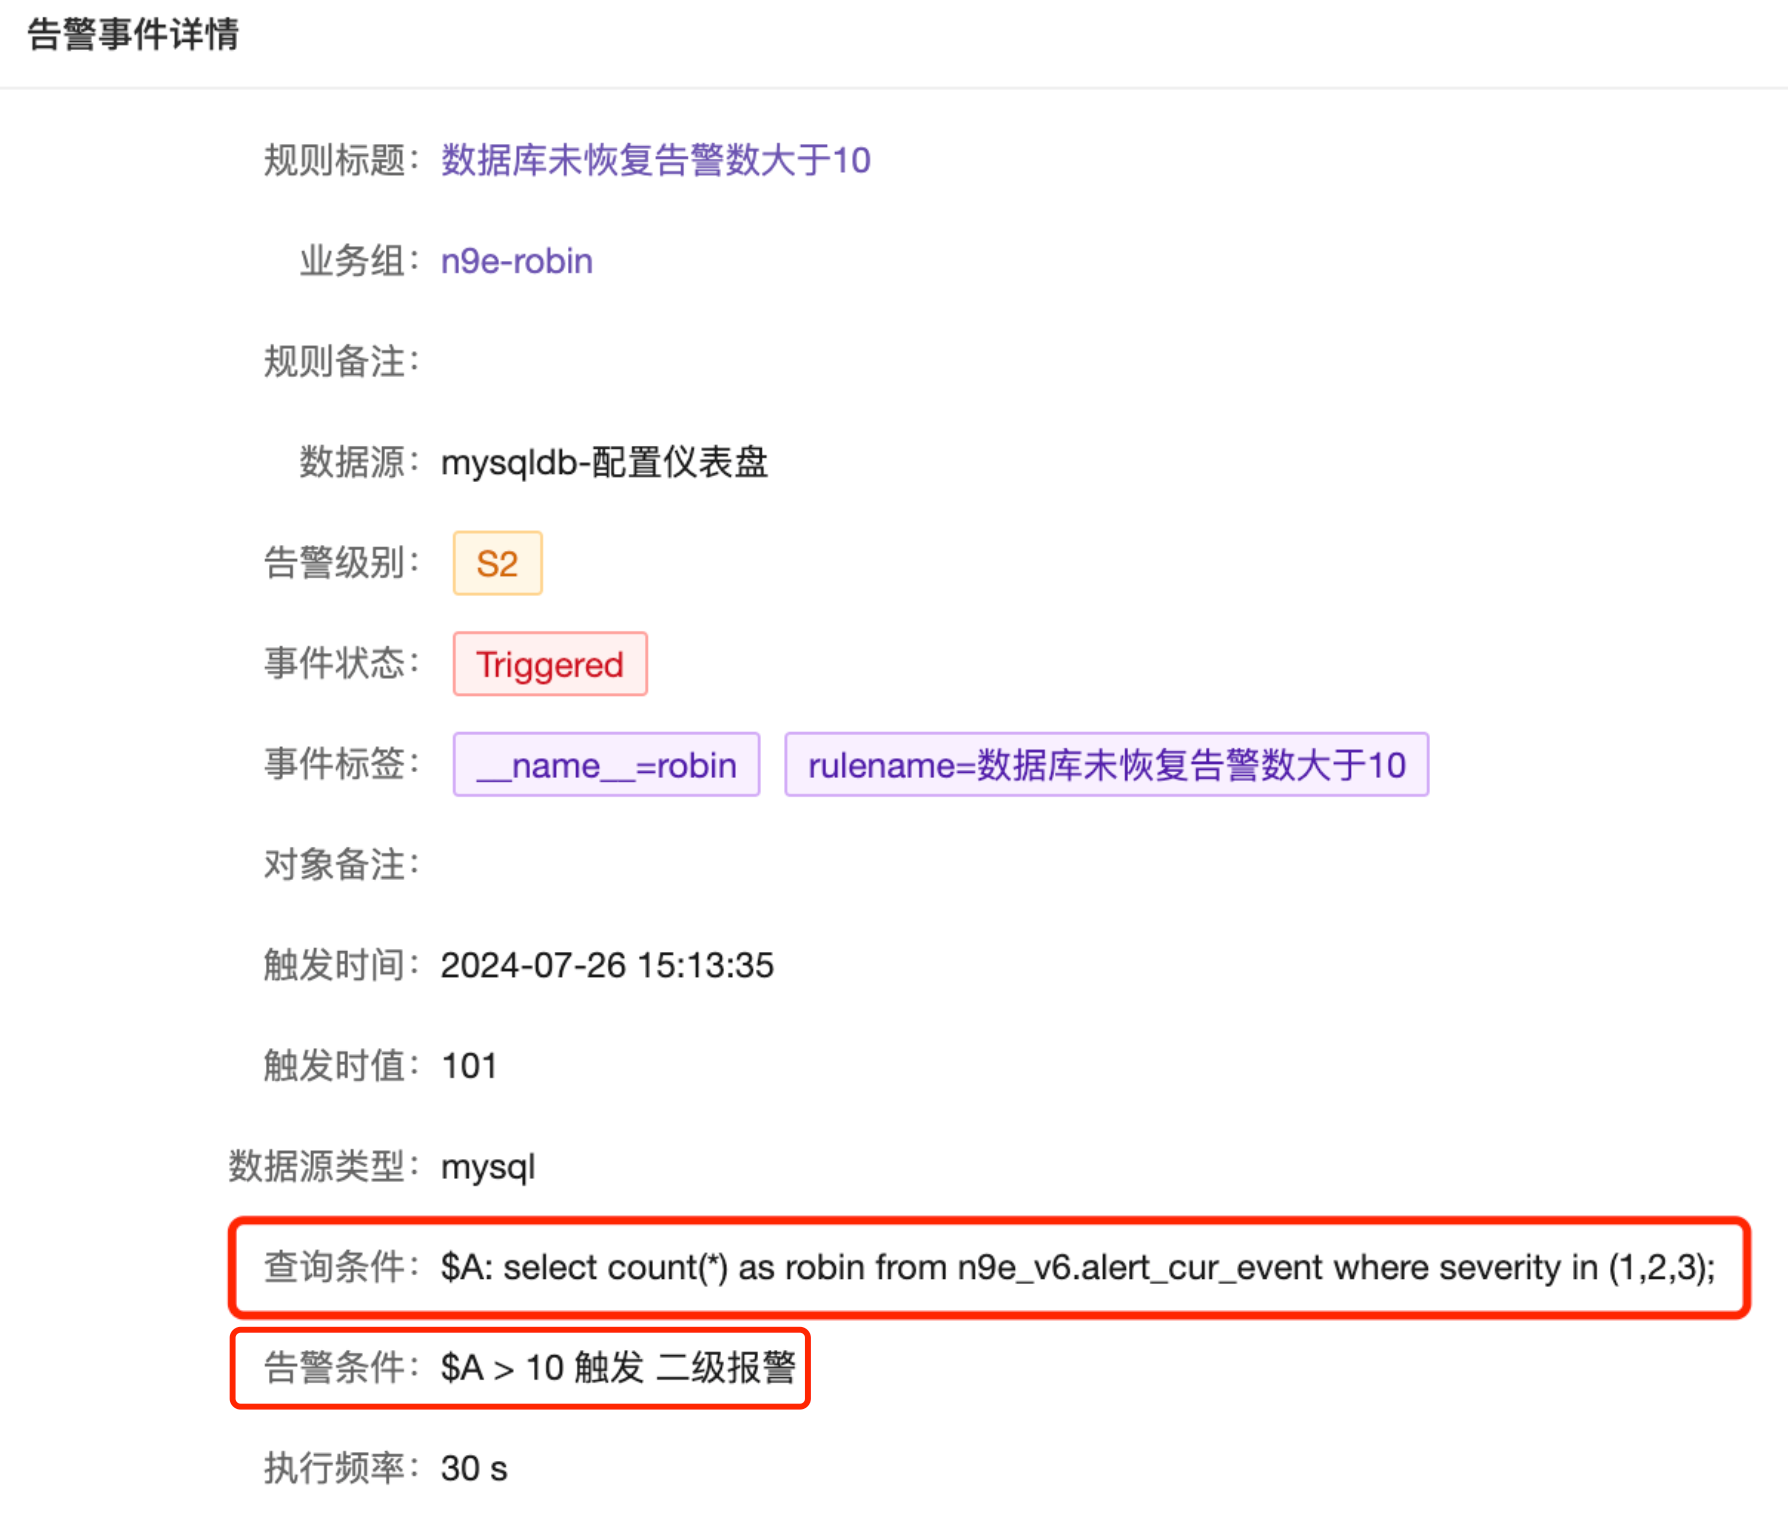
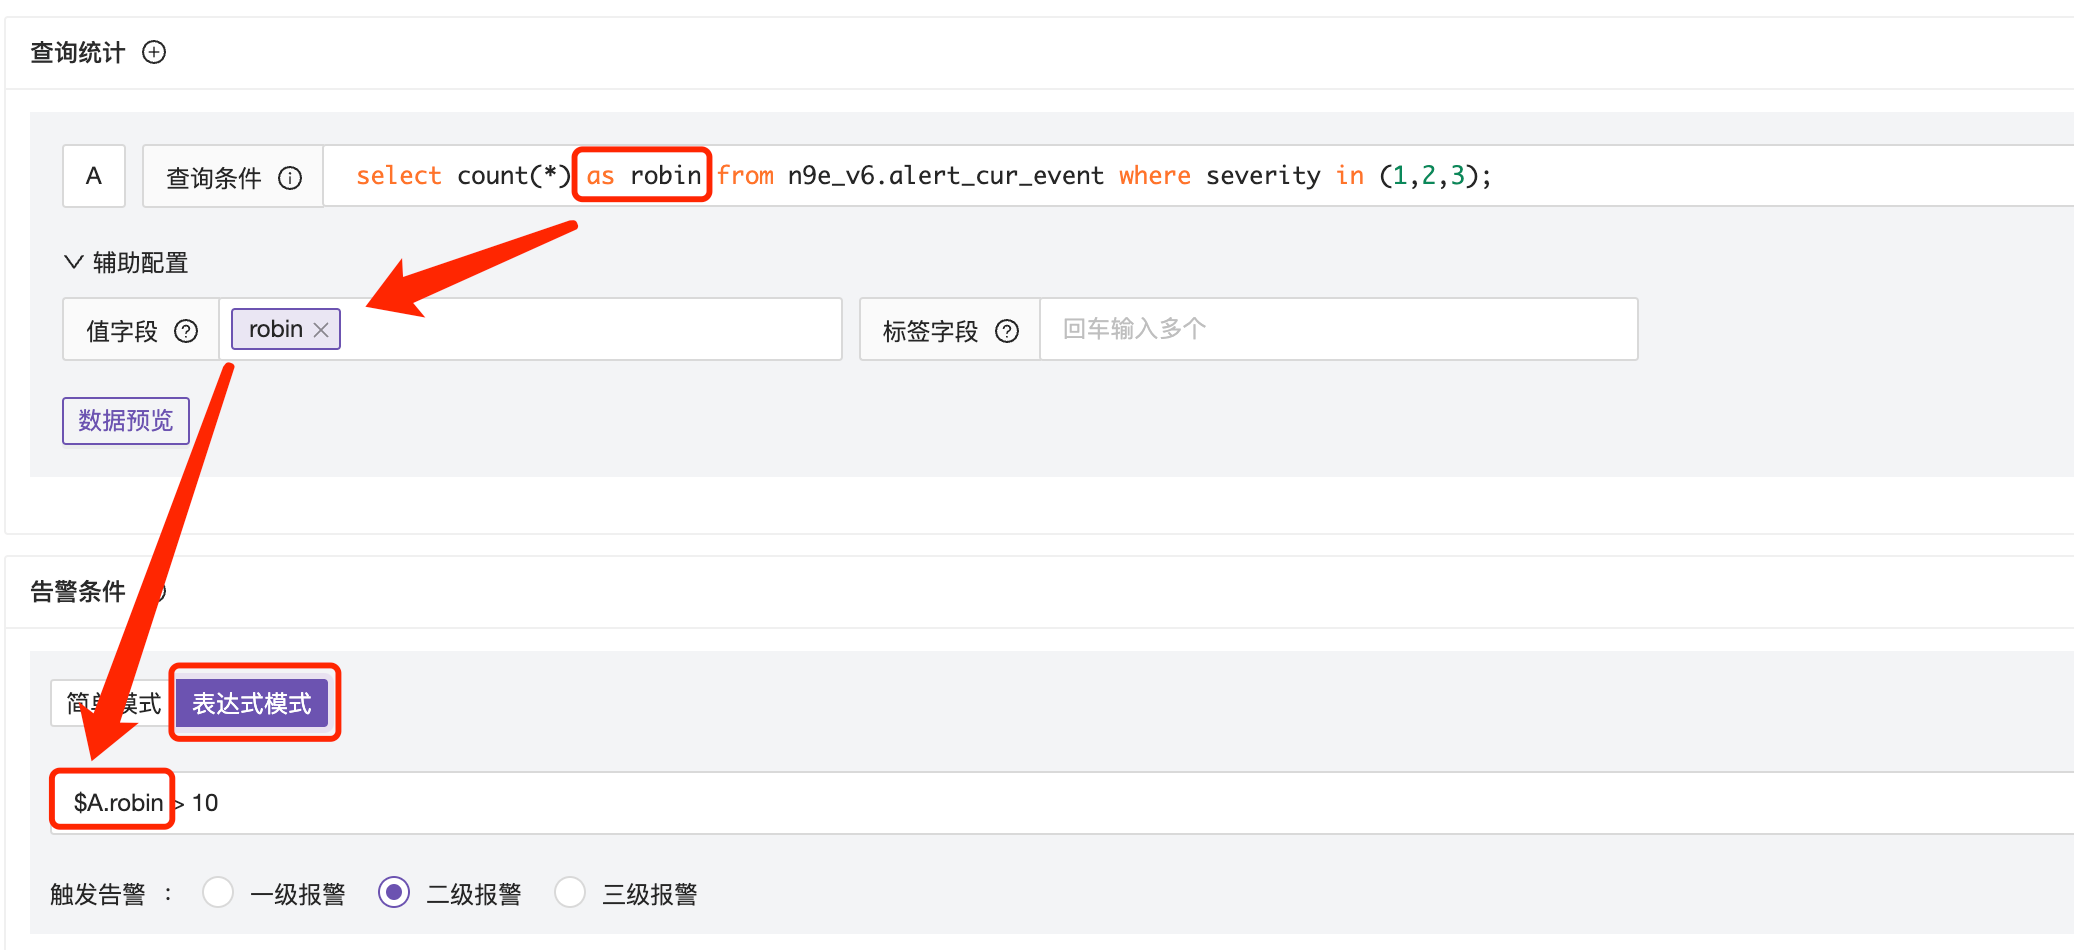
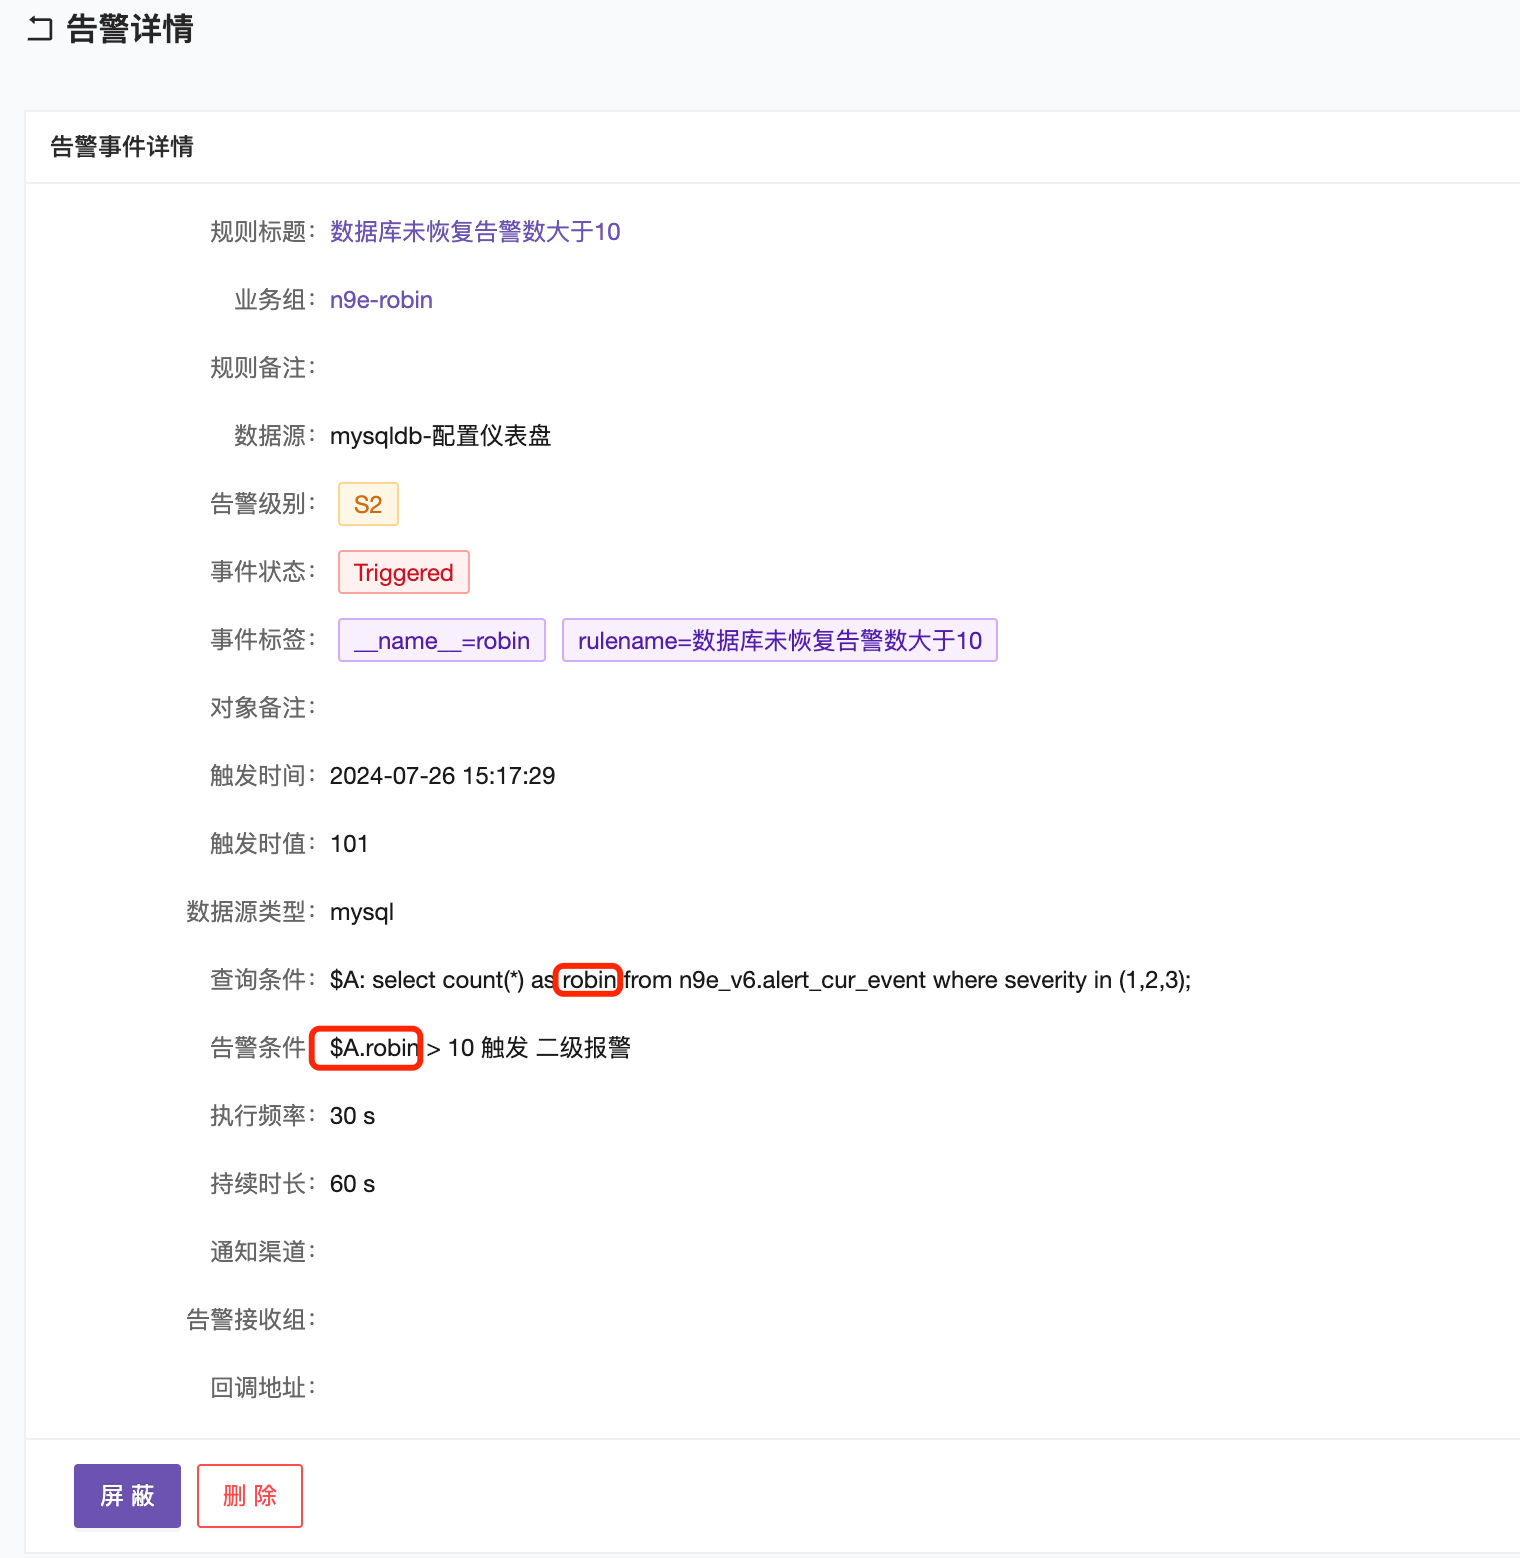
● Expression Mode
The result of the query statement is stored in $A, and the threshold is set using $A.robin. As shown below, the final trigger threshold uses $A.robin > 10.
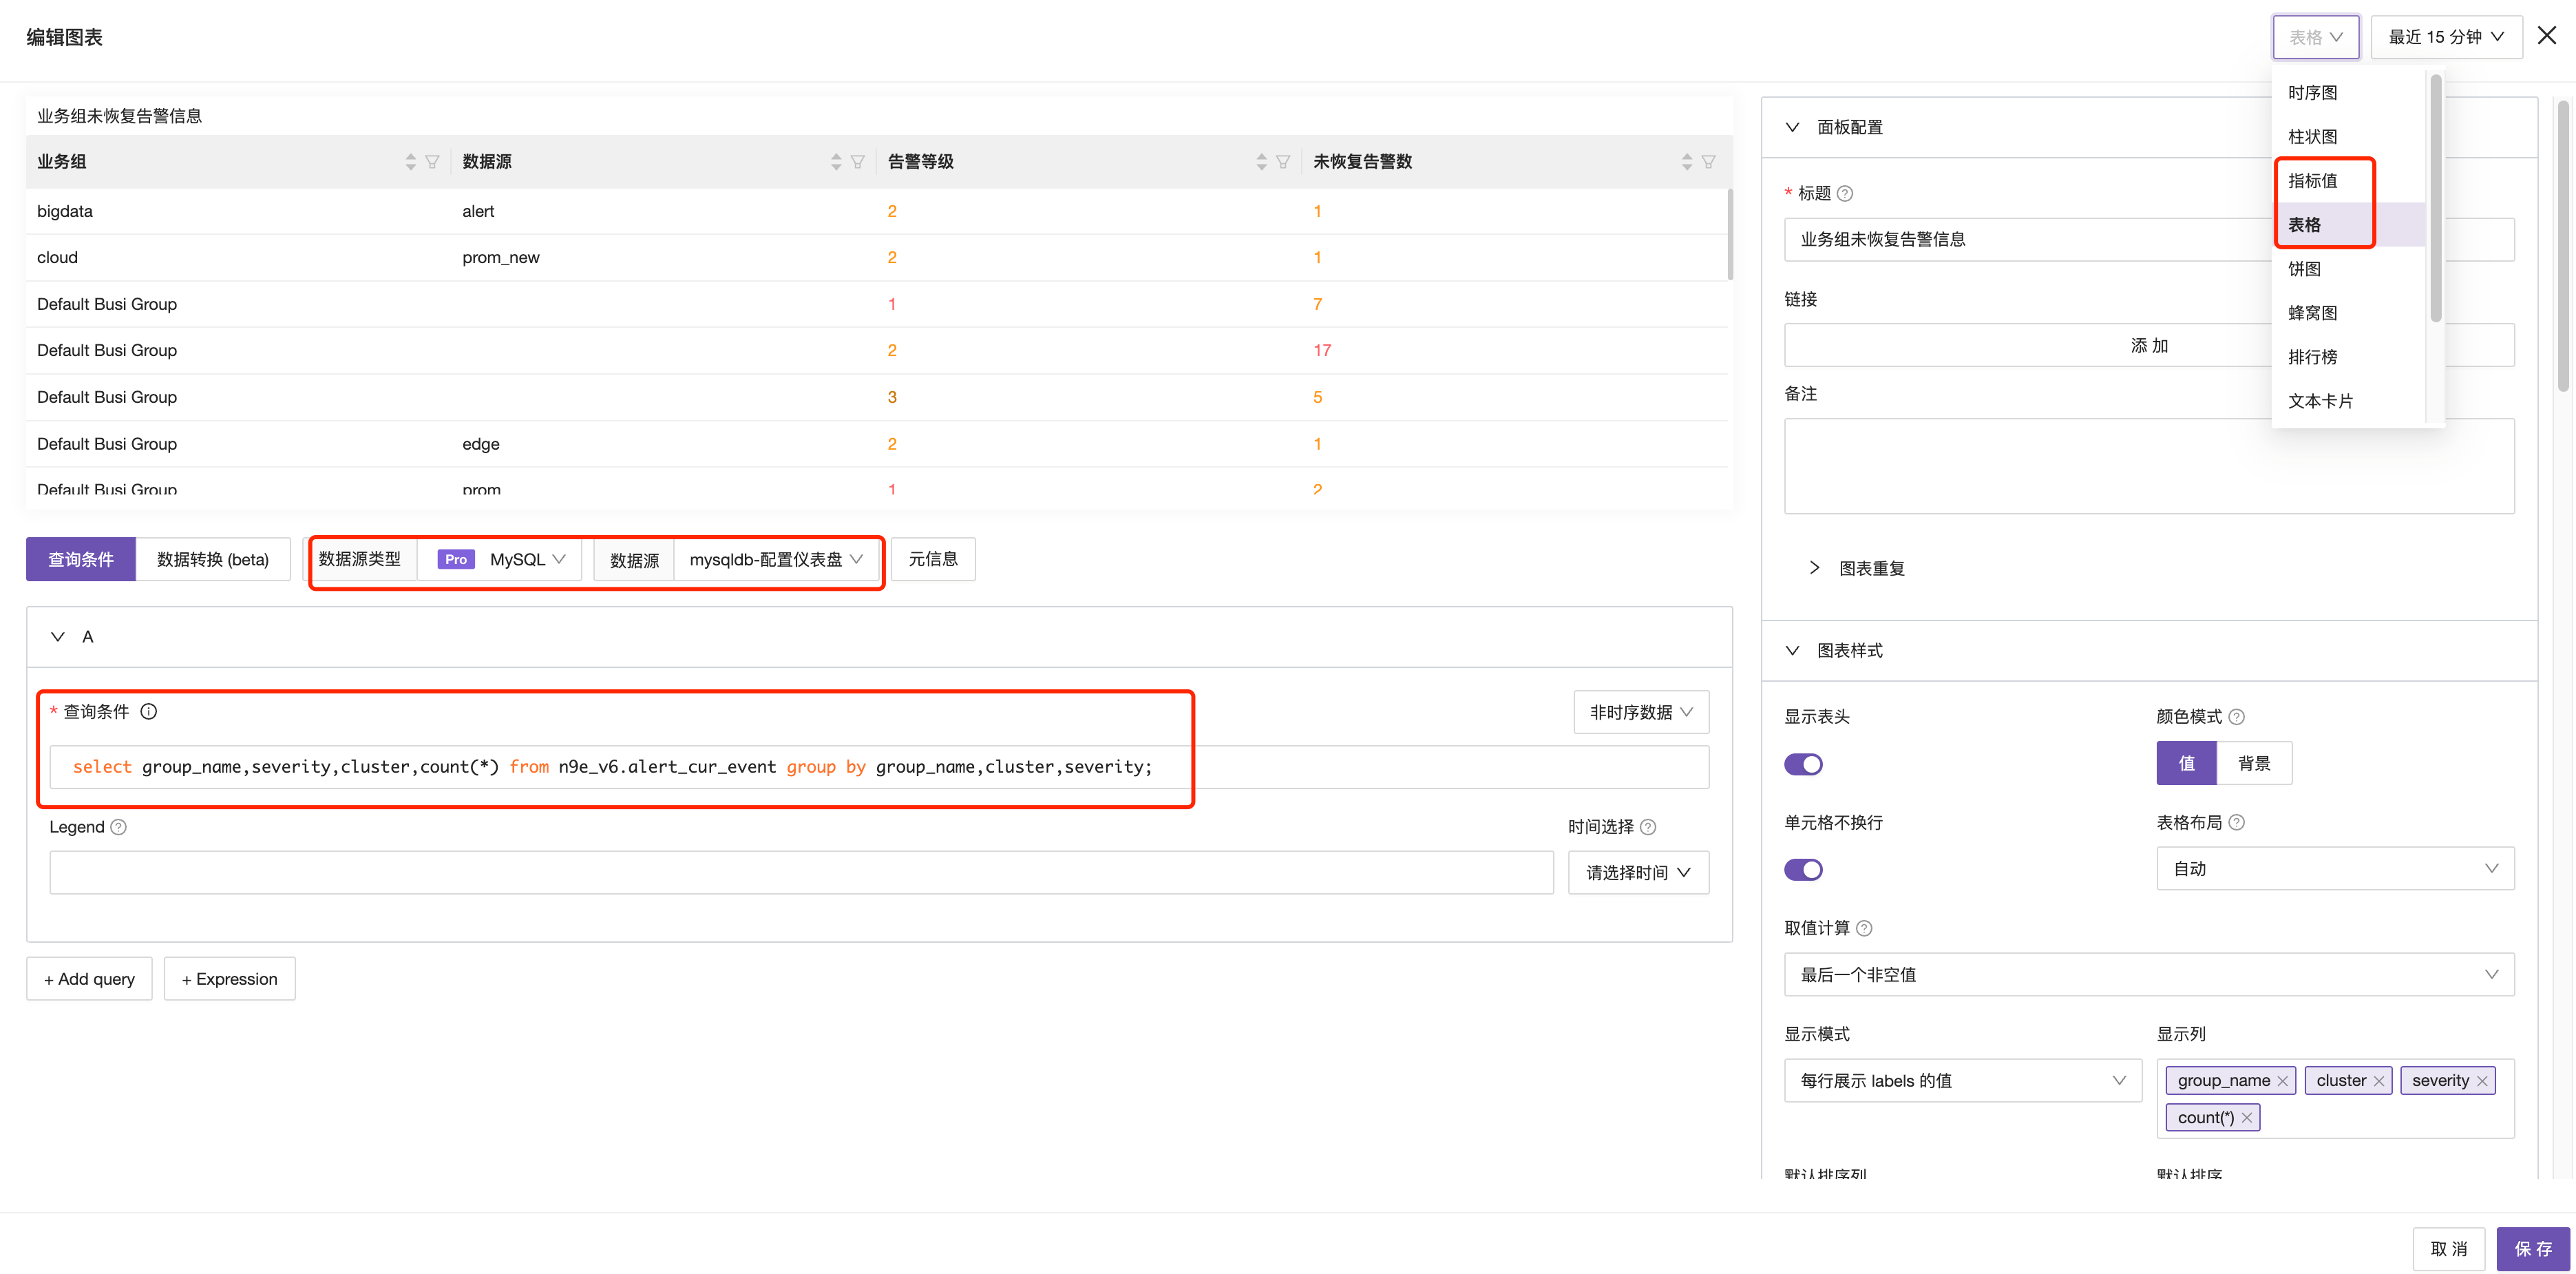
Configure Dashboard
In the monitoring dashboard, you can use the MySQL data source to configure the dashboard. It is recommended to display the dashboard as disconnected indicator values and table types. Below is a basic configuration of a dashboard with core attention points marked in red.