


Integrating CLS Data Source
When creating a data source connection, you mainly need to fill in the following parameters:
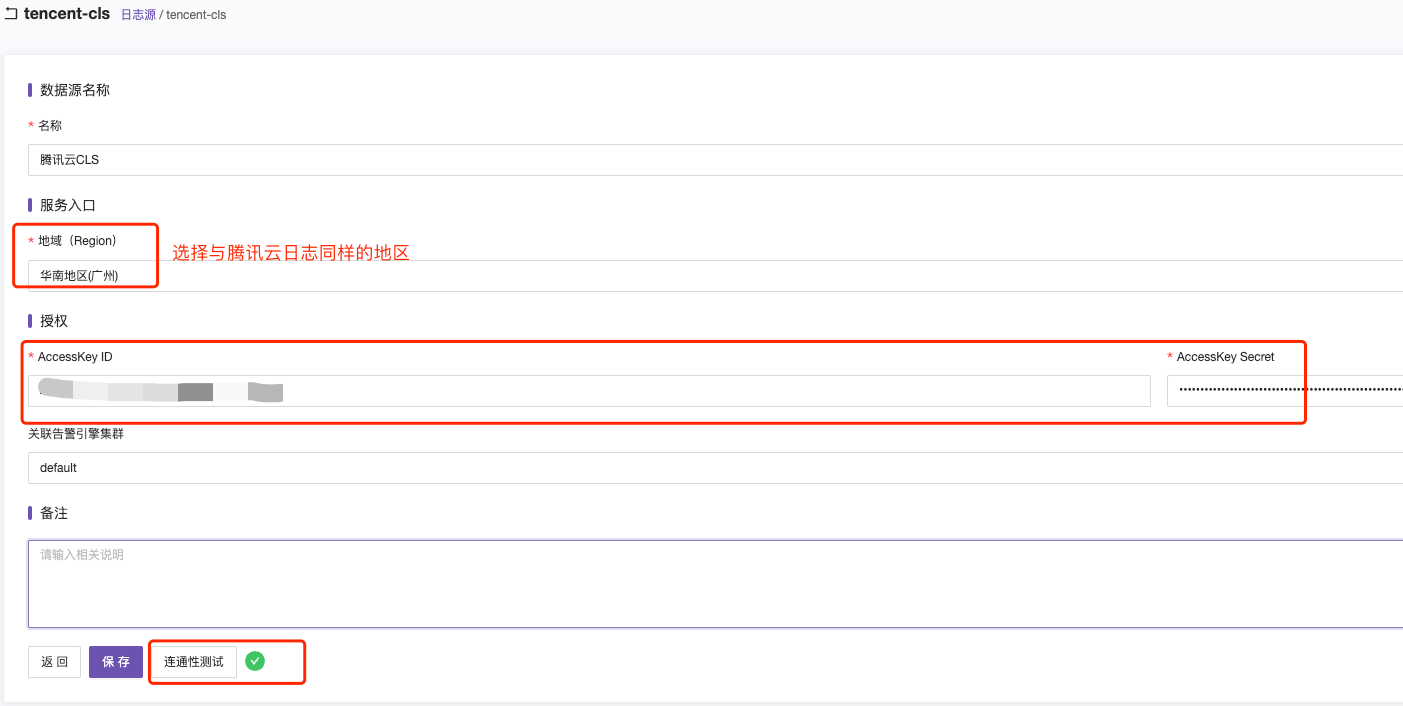
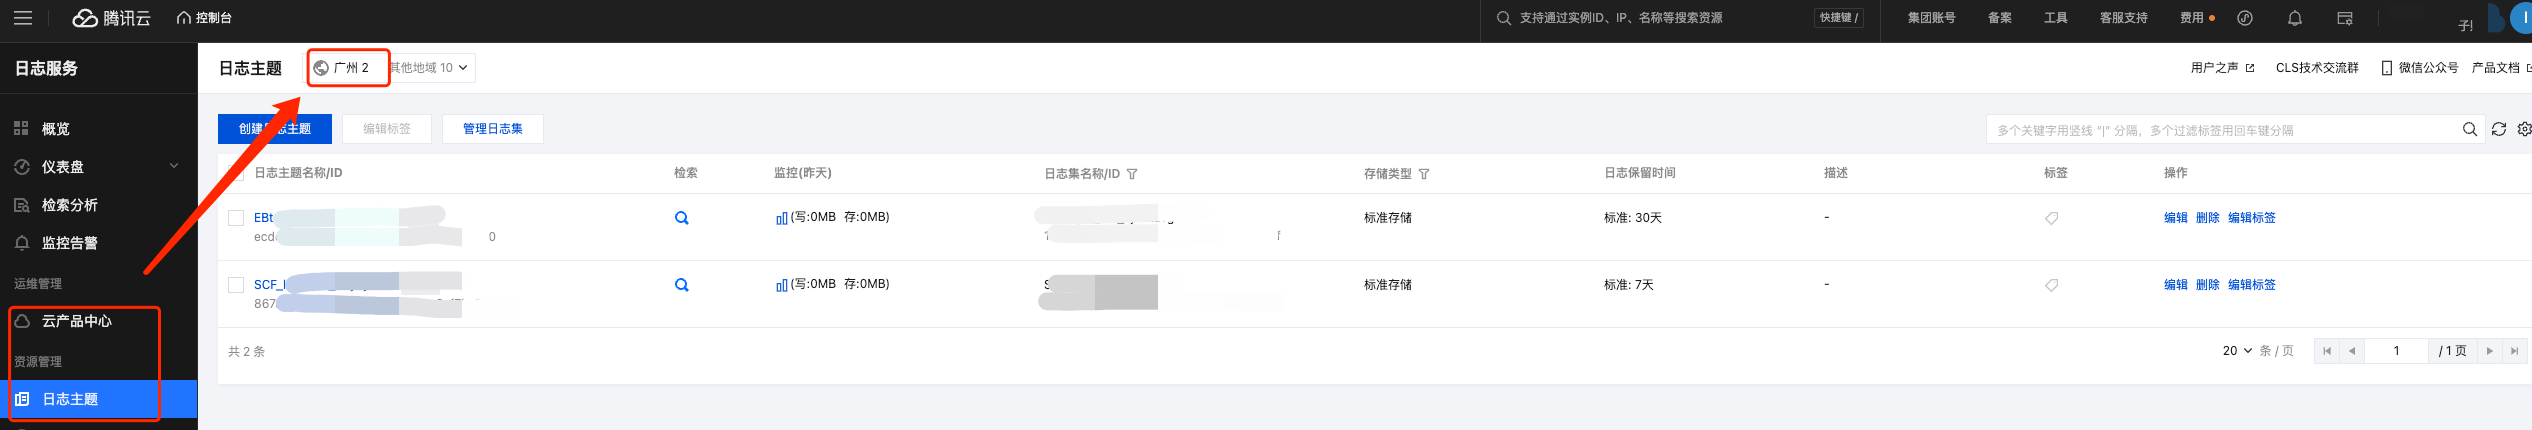
Region can be found in Tencent Cloud CLS’s log topic, and it needs to be consistent with the region where the Tencent Cloud log topic is located. As shown below:
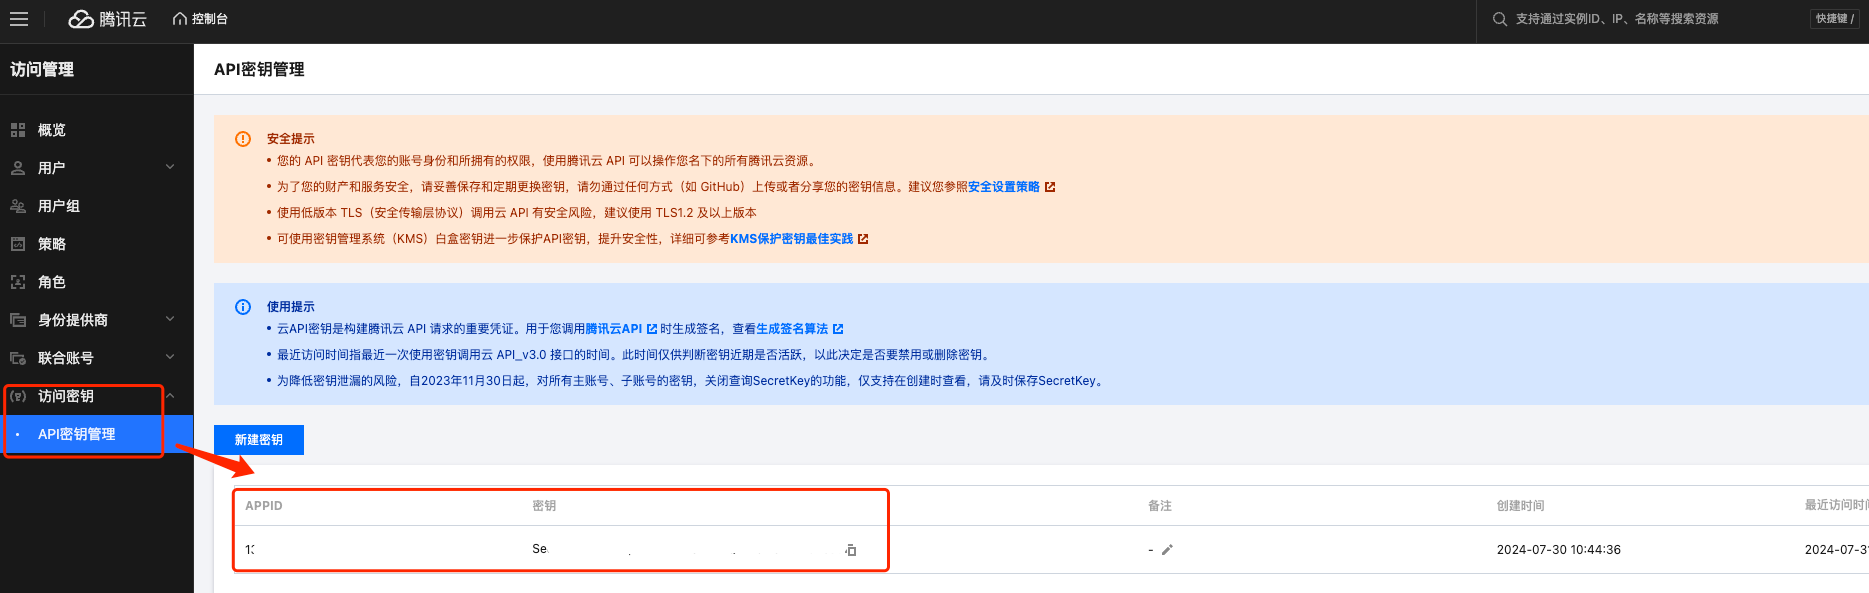
AK ID and AKS can be viewed and created in the Tencent Cloud User Key Management.
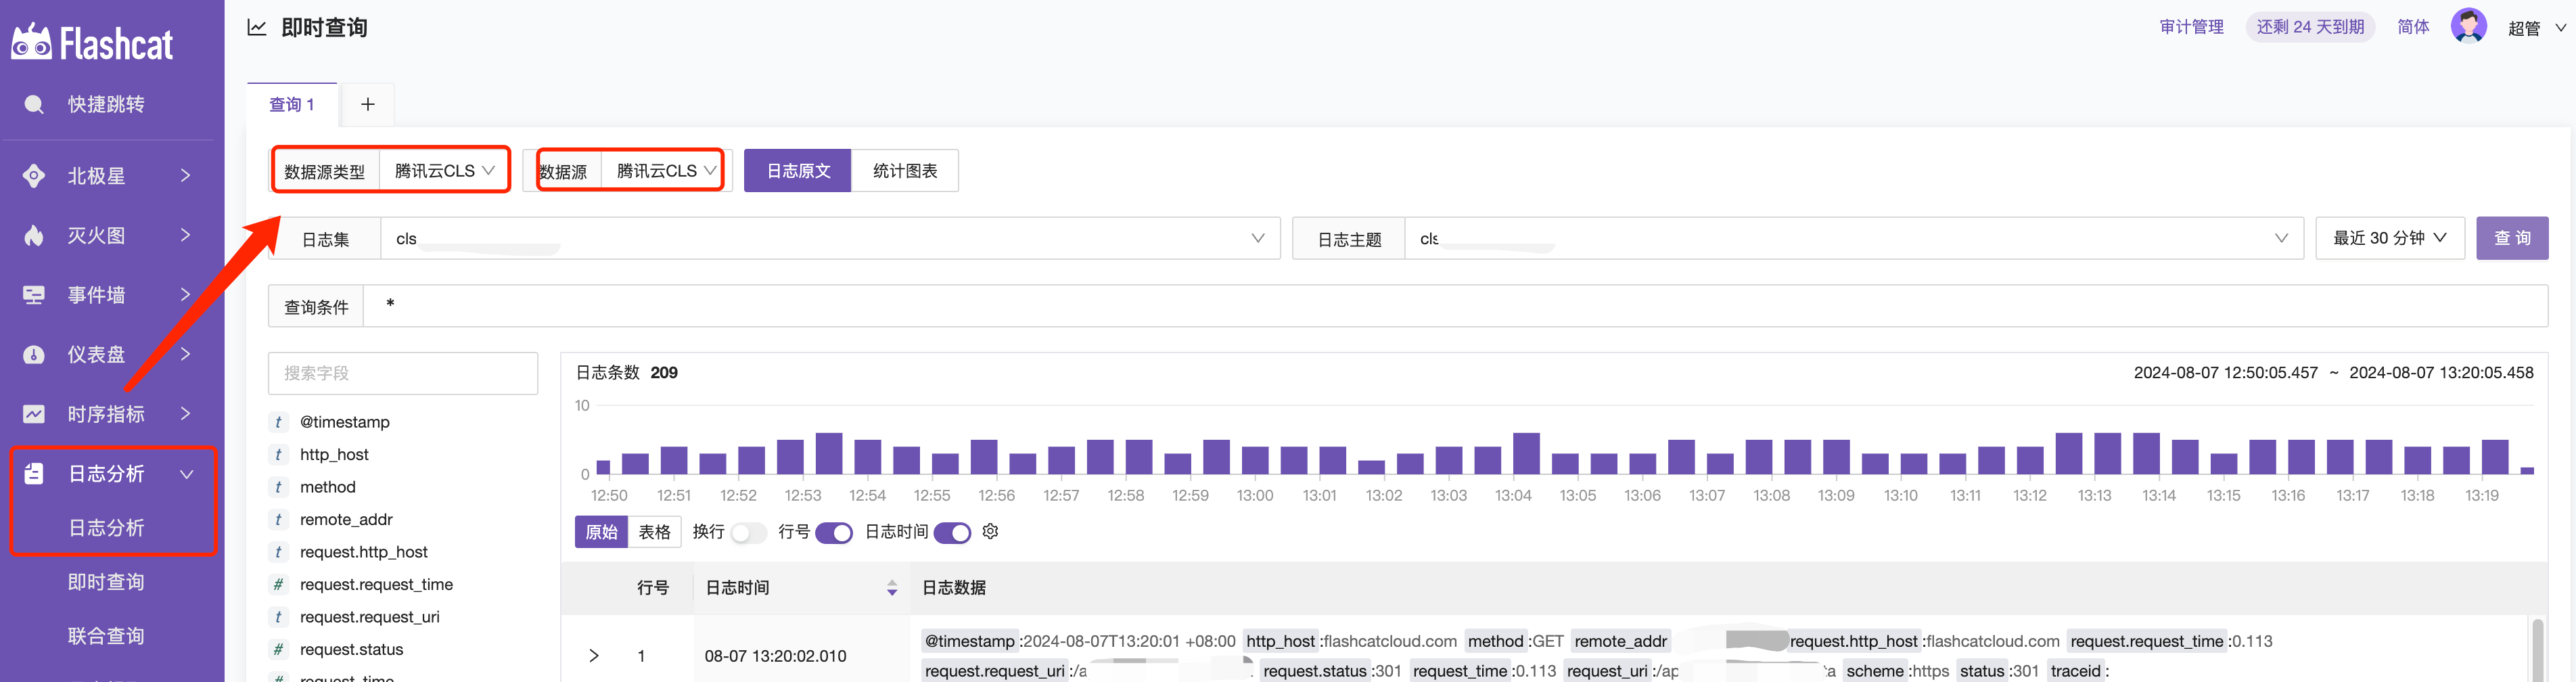
CLS Log Query
Raw Logs
Displays the raw data from Tencent Cloud CLS, without any processing.
Statistical Charts
Statistical charts display the results of query conditions, and they can be presented in two forms: table charts and time series charts.
Table Chart
Based on the query condition example |SELECT status, count(*) as pv GROUP BY status, it queries the status field, names the statistical result pv, and displays the results grouped by status in a table.
Statement Breakdown
| select ...: The left side of the pipe|is the retrieval condition; the right sideselect ...is the SQL statement.
status: Represents a field in the log data.
count() AS pv*: Counts the occurrences of each status and names the count result as pv.
GROUP BY status: Groups the query results by the status field.
You can refer to syntax rules for more information.

Time Series Chart
The time series chart extracts values from Tencent Cloud CLS log query results and displays the filtering conditions as tags in the indicators. Below are some query examples for you to learn and understand.
Common Search Conditions Syntax
- Search logs of
GETrequests that failed (status code greater than 400):method:GET AND status>400 - Search logs with
ERRORorWARNINGlevels:level:(ERROR OR WARNING) - Search logs that are not of
INFOlevel:NOT level:INFO - Search logs that do not have the
remote_userfield:not remote_user:* - Search logs that have the
remote_userfield:remote_user:* - Search logs where the
hostfield value is not123:not host:123.*
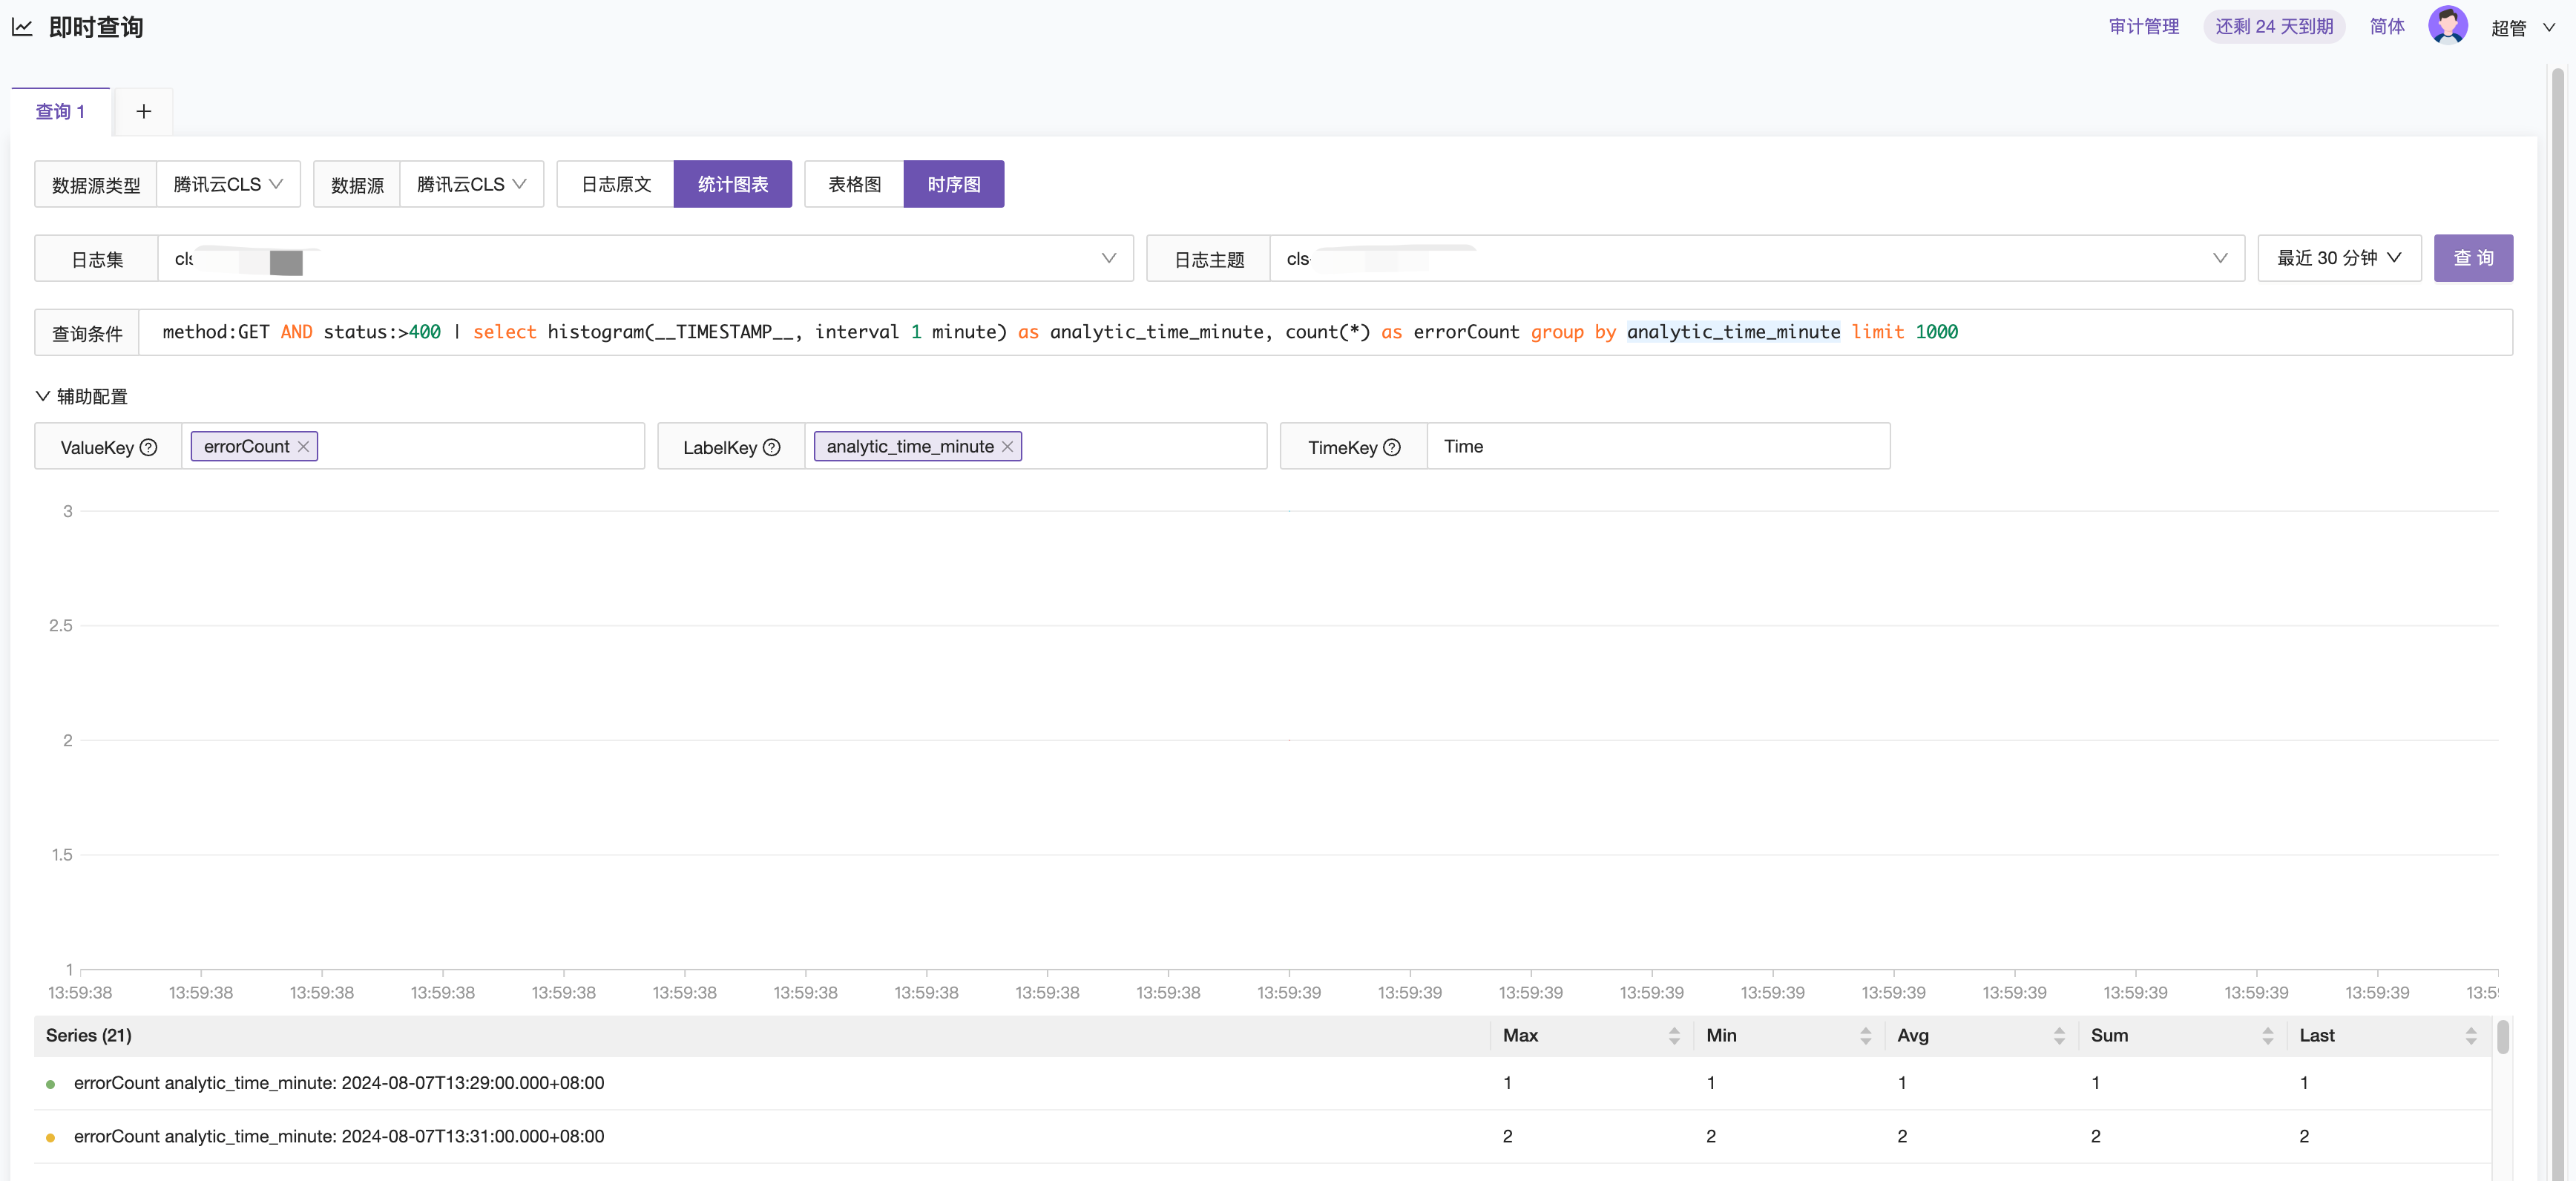
Scenario 1: Counting logs of GET requests that failed (status code greater than 400) per minute
method:GET AND status:>400 | select histogram(__TIMESTAMP__, interval 1 minute) as analytic_time_minute, count(*) as errorCount group by analytic_time_minute limit 1000
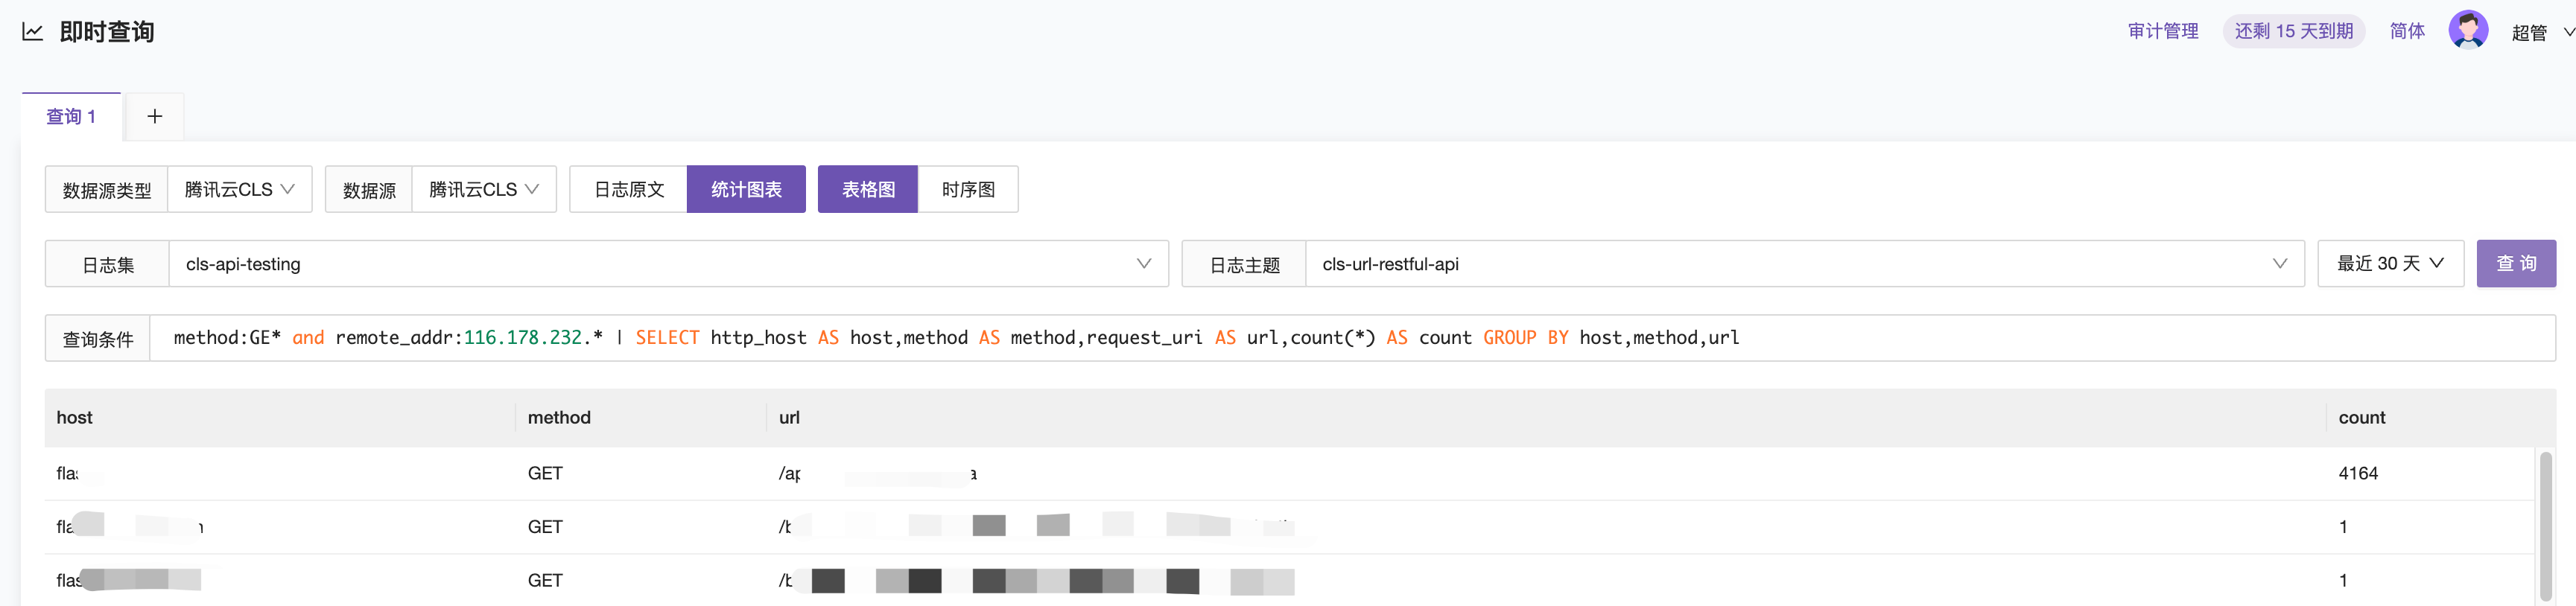
Scenario 2: Querying data where the request_method field starts with GE and the client_ip field is in the range 116.178.232.*, and grouping statistics by host, method, and request_uri.
method:GE* and remote_addr:116.178.232.* | SELECT http_host AS host, method AS method, request_uri AS url, count(*) AS count GROUP BY host, method, url
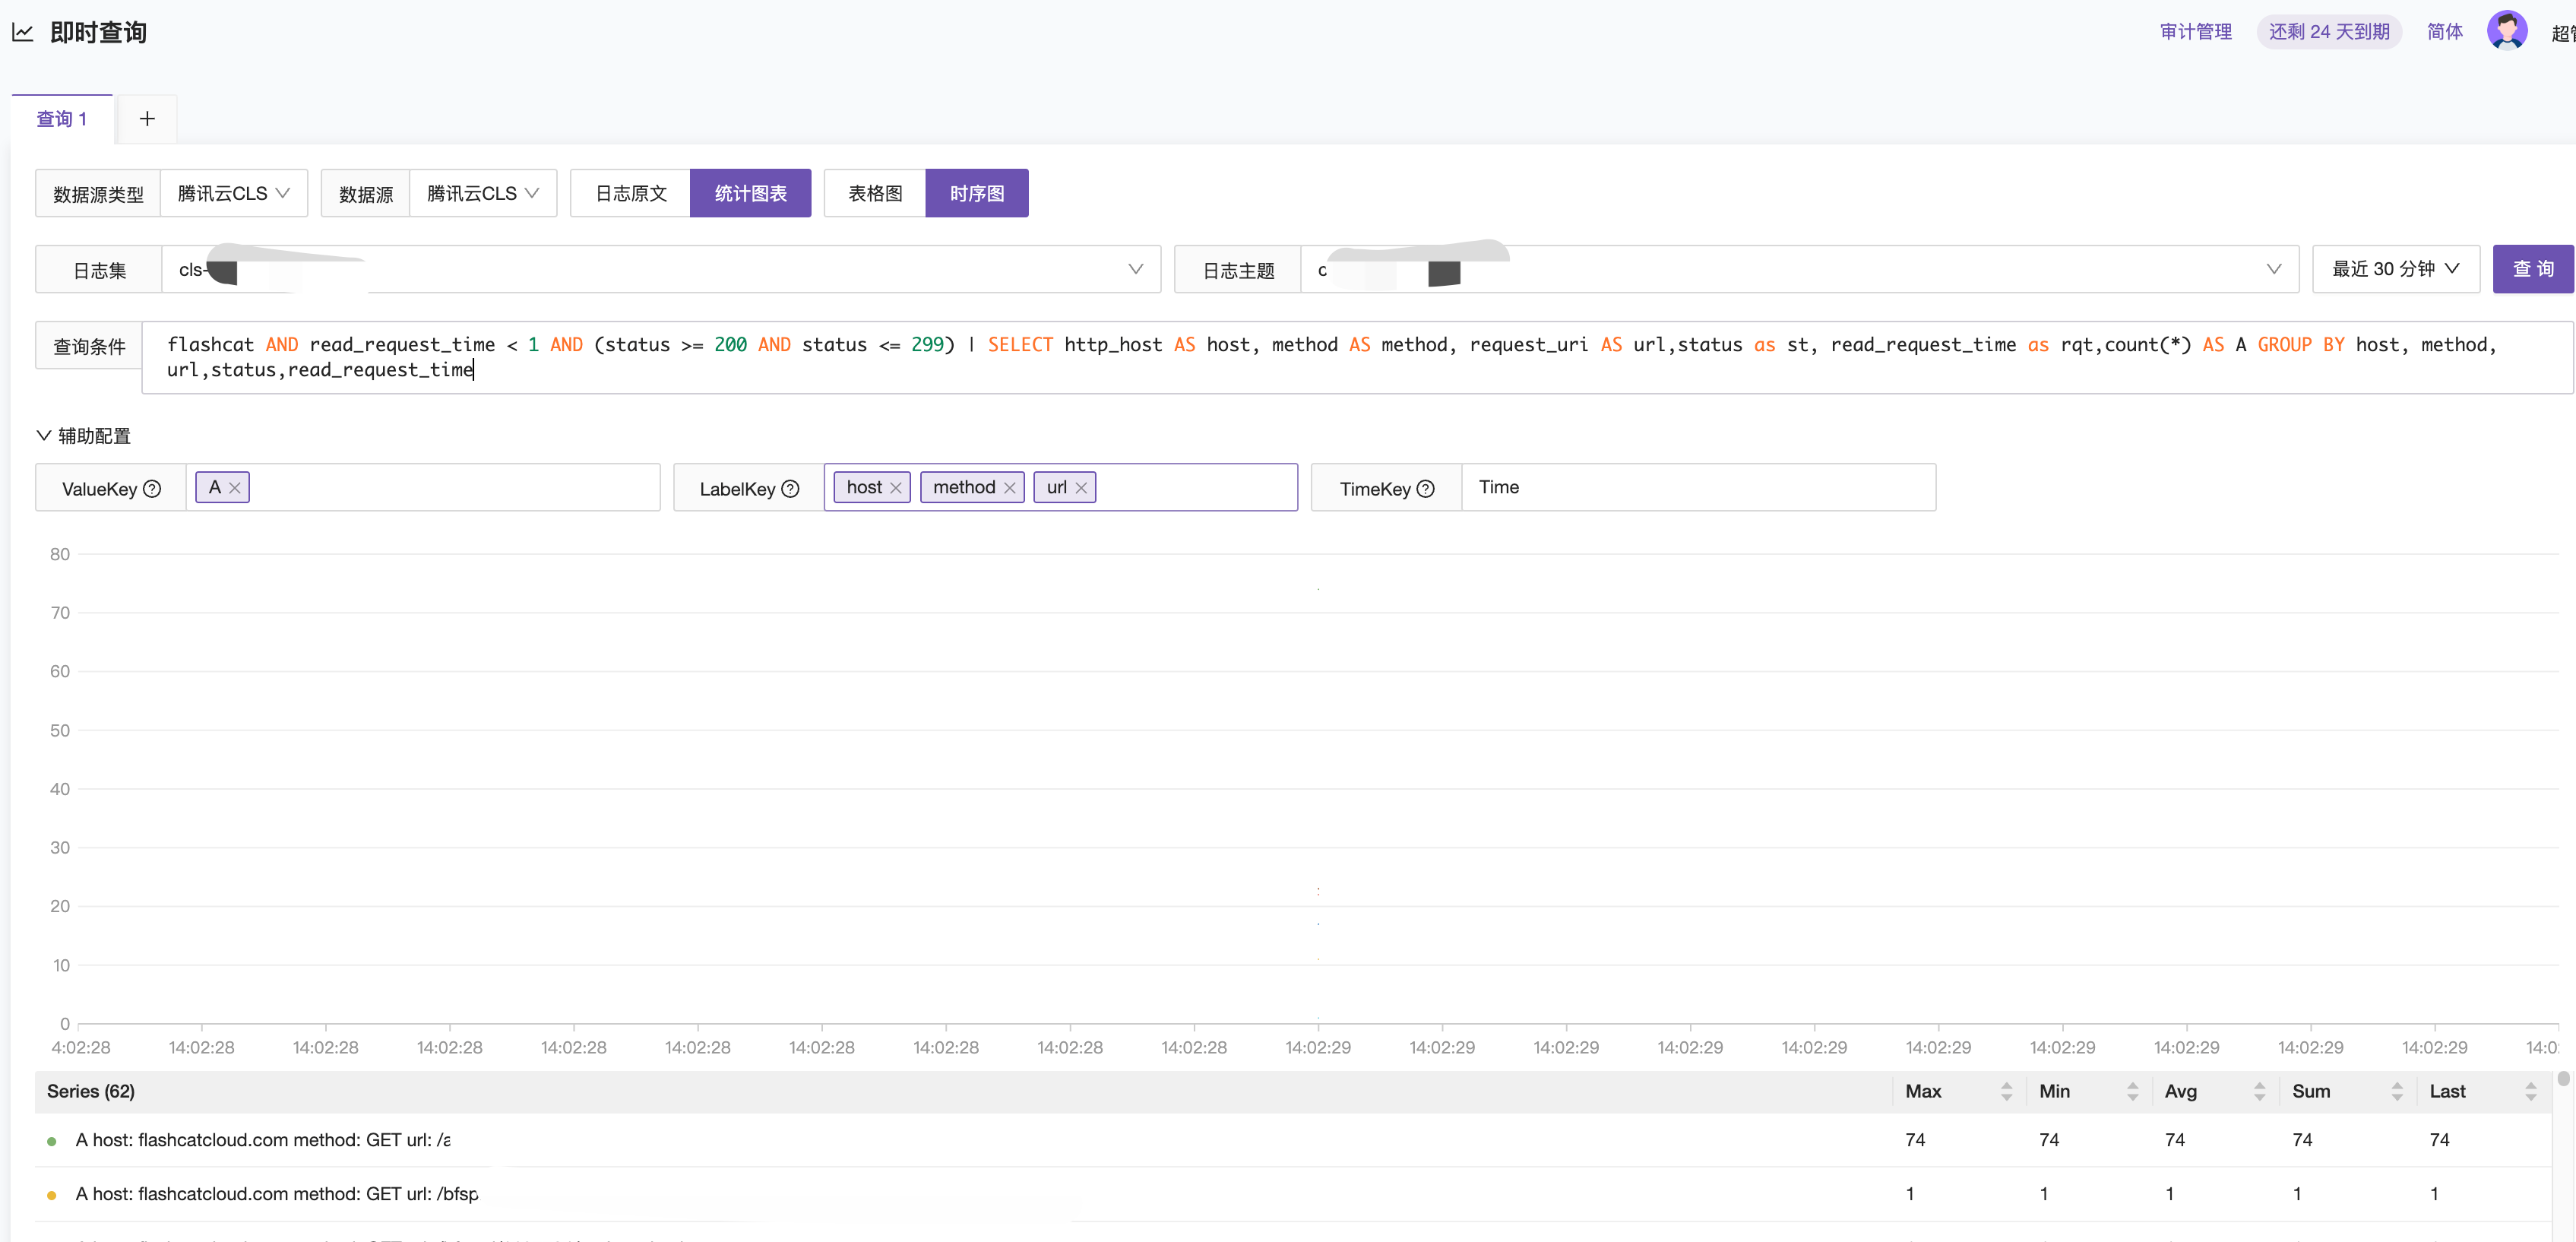
Scenario 3: Querying logs of successful requests that took less than 1 second and contained the string flashcat, and grouping statistics by host, method, request_uri, status, and request_uri.
flashcat AND read_request_time < 1 AND (status >= 200 AND status <= 299) | SELECT host AS host, request_method AS method, request_uri AS url, status as st, read_request_time as rqt, count(*) AS COUNT GROUP BY host, method, url, st, rqt
CLS Log Alerts
In the Alert Rules section, select the log data source, configure the query statement and extract value ValueKey, and then set the threshold for ValueKey within the specified time using the simple mode.

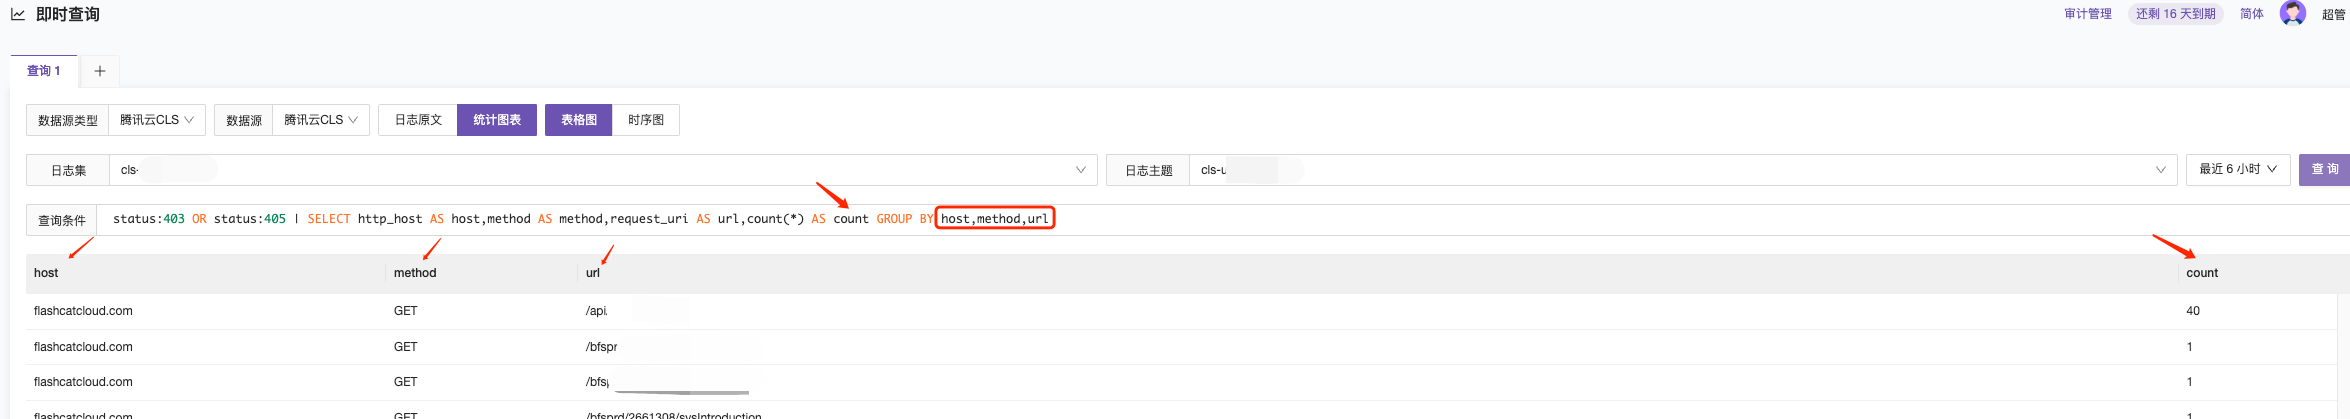
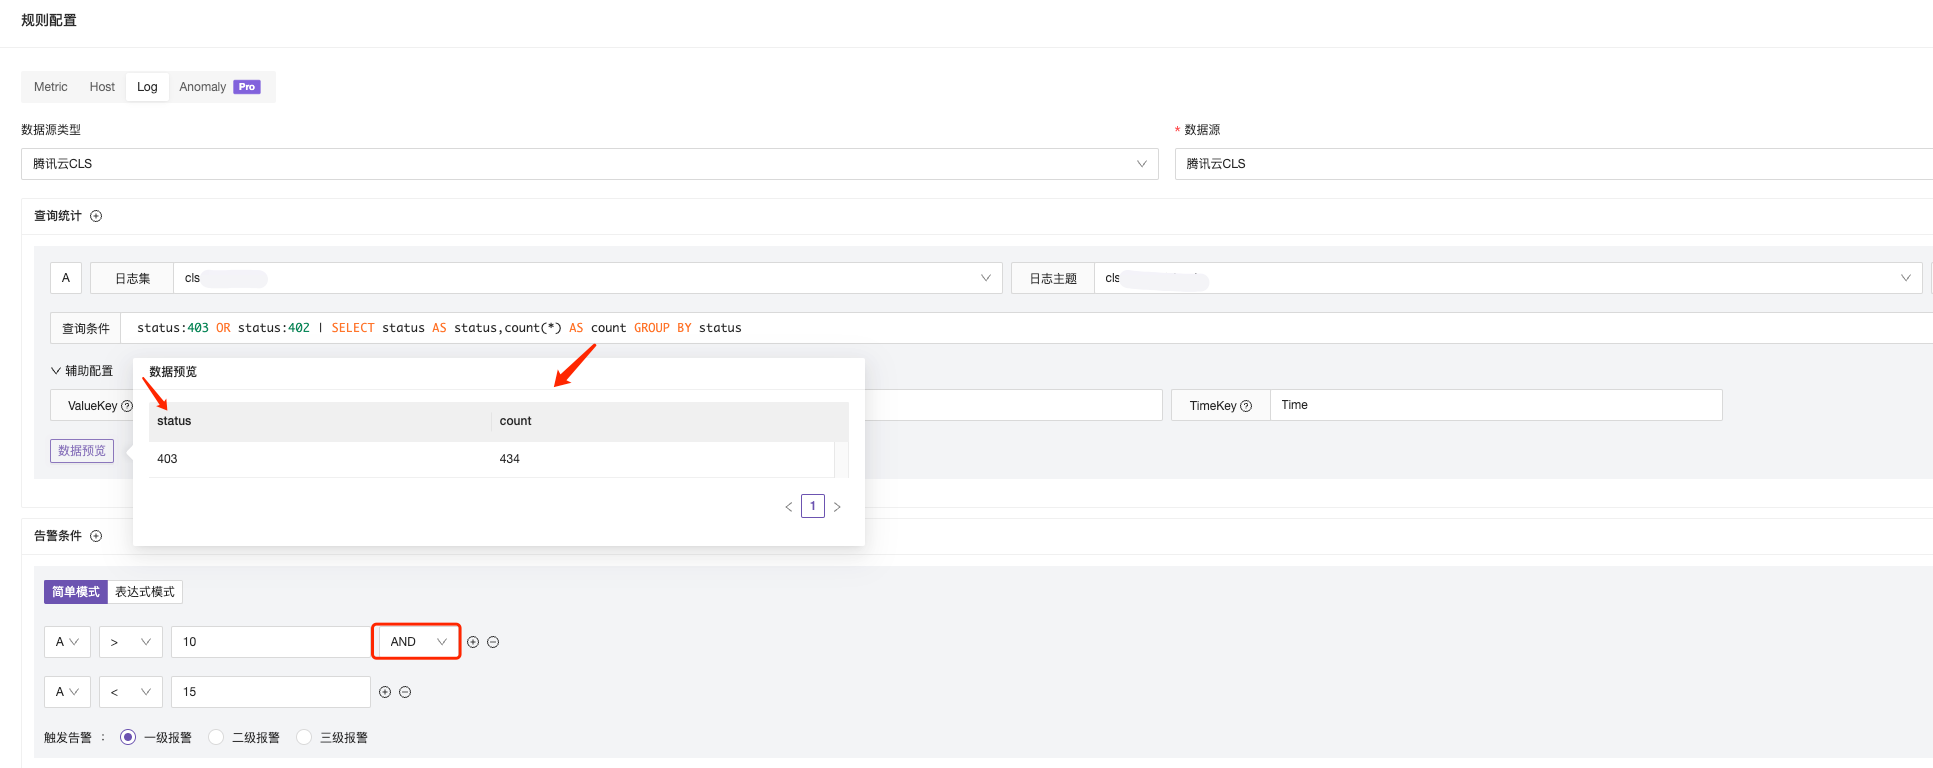
Configuration Scenario 1: Query the number of logs with status code 200 and 301 in the proxy logs. If the query result is greater than 10 and less than 15, trigger an alert.
The query statement is as described above: status:403 OR status:402 | SELECT status AS status, count(*) AS count GROUP BY status. Here, the query value result is used for condition judgment, so the condition judgment uses $A > 10 and $A < 15.
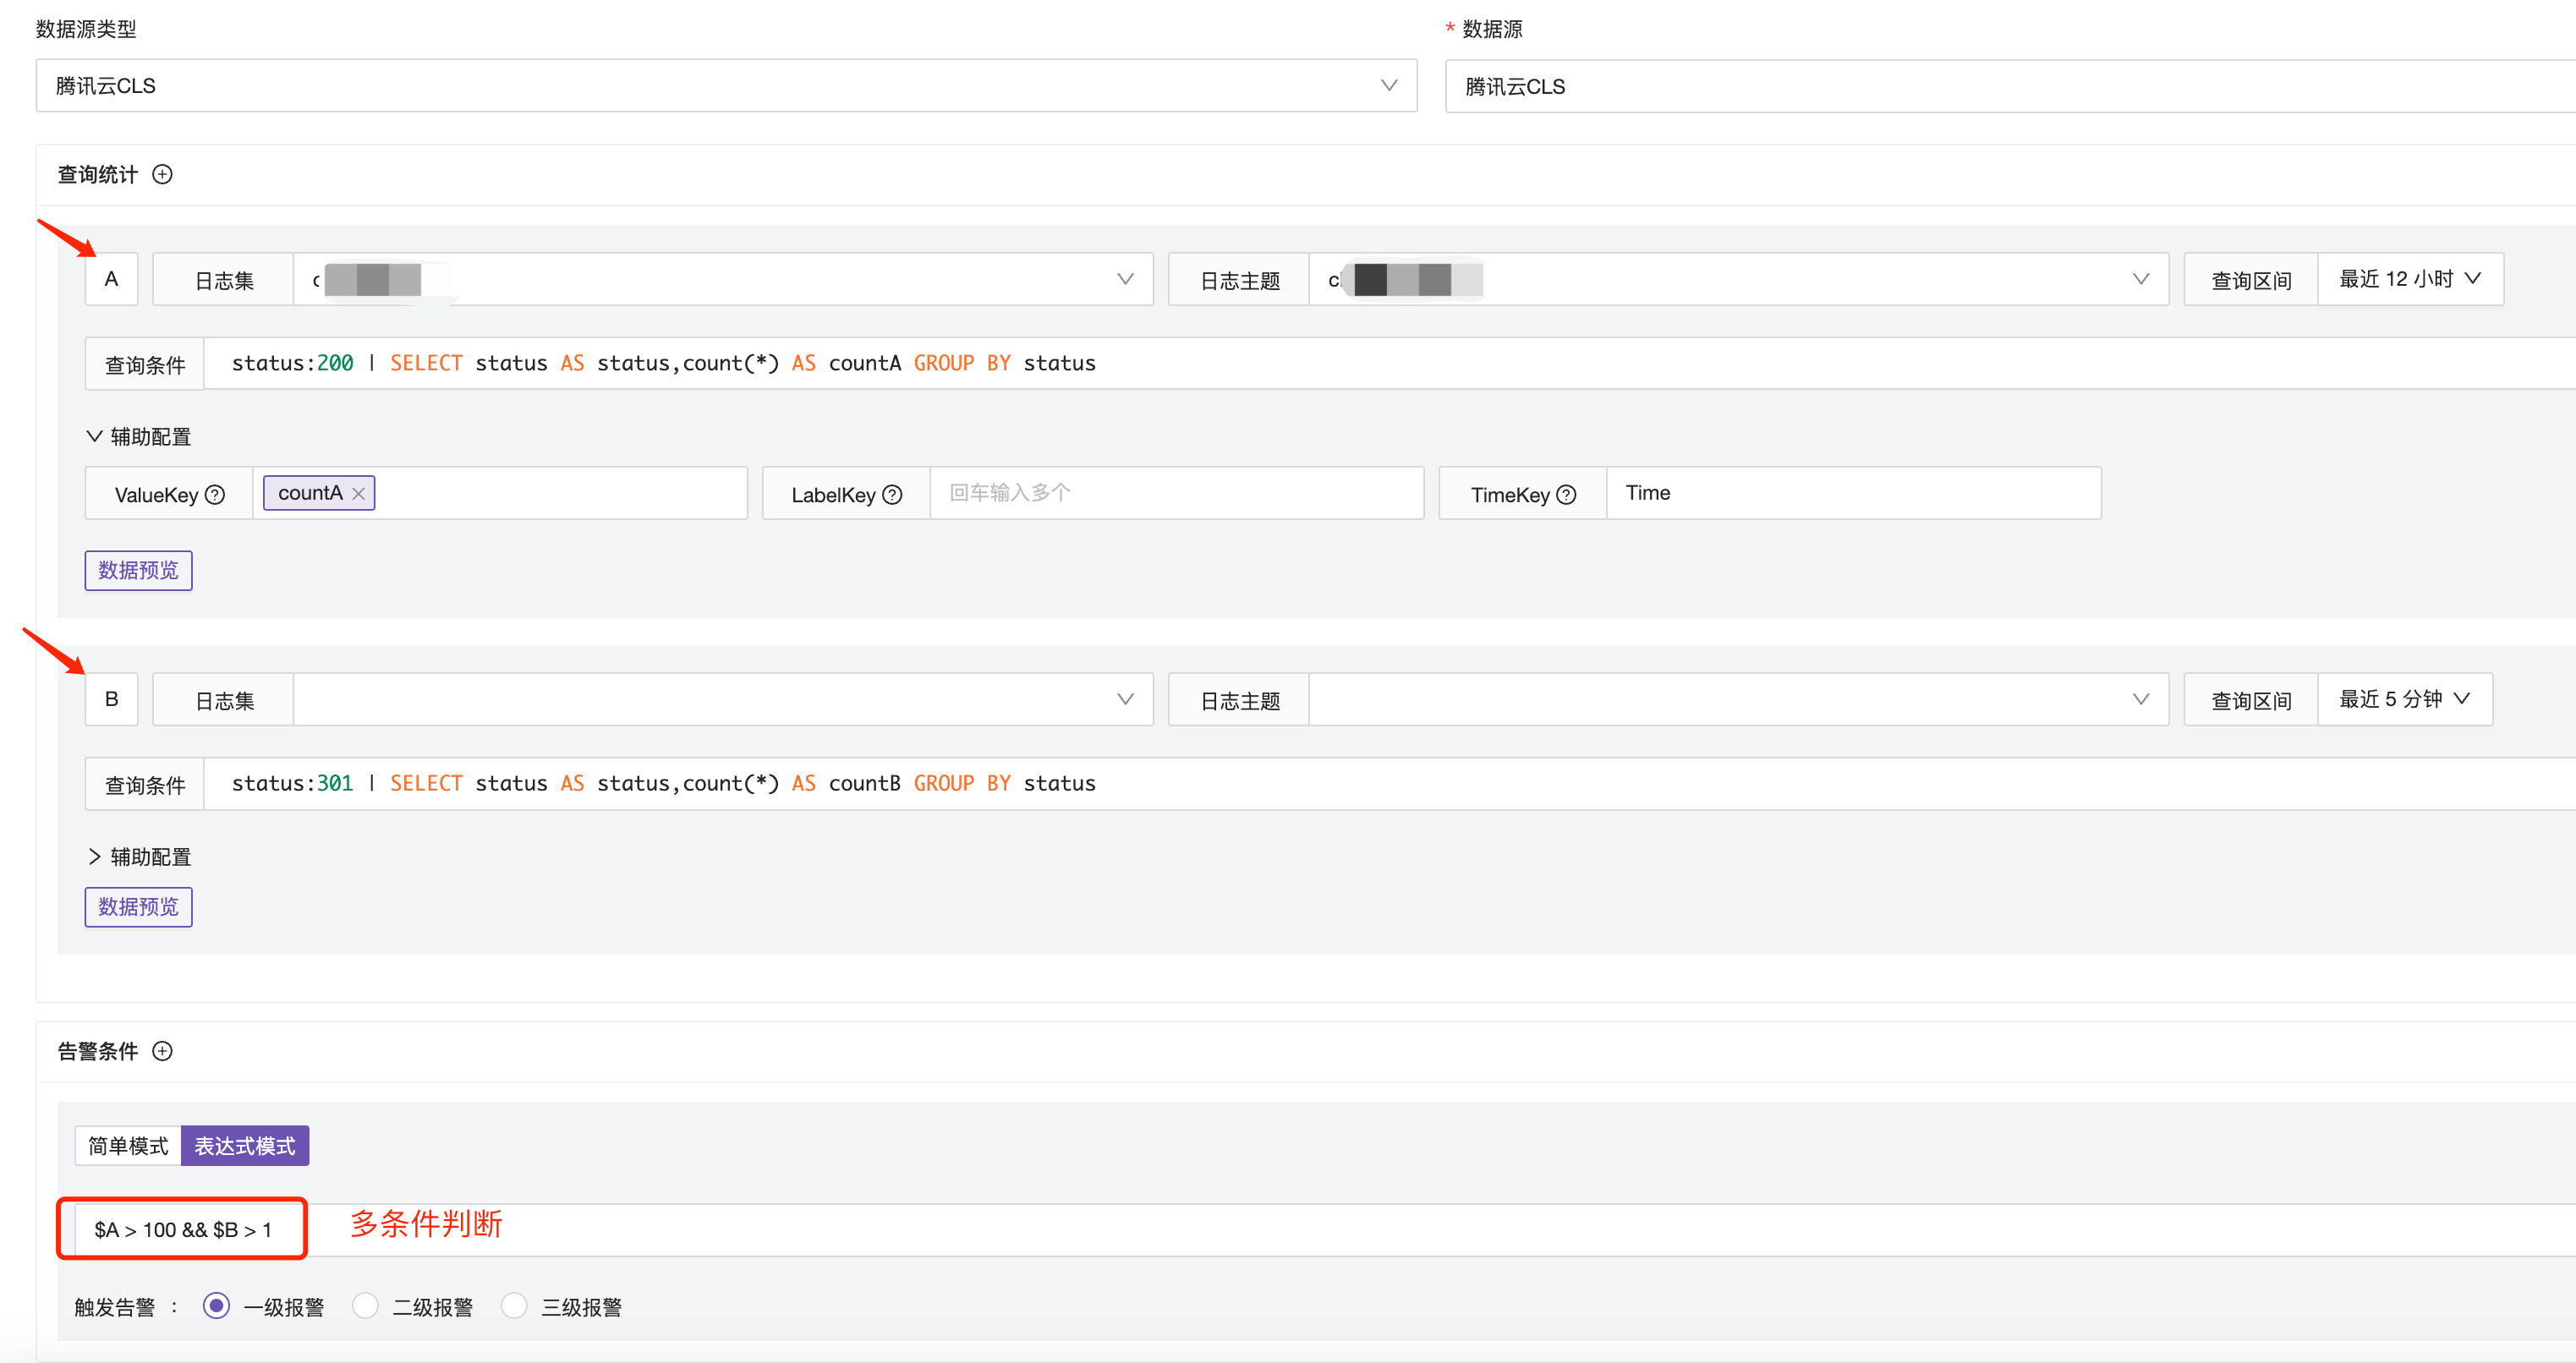
Configuration Scenario 2: Configure different metrics for result judgment. Trigger an alert if status:200 is greater than 100 and status:301 is greater than 1.
To achieve different query value judgments, you need to fill in two different query analysis statements, extract the values, and perform judgment using the extracted values $A and $B.
Note:
-
Similar to PromQL, if the data labels are inconsistent, the query analysis statements will be treated as two different curves and cannot be compared. In this case, do not set the
LabelKeyto ensure that the data curve can be calculated without being affected by different labels. -
Currently, only “equal to” numerical comparisons are supported, but not “equal to” string comparisons. Therefore, when filtering strings, you need to place the string in the query statement.
Troubleshooting
If alerts do not work properly after configuration, you can check the N9E’s INFO.log logs by filtering for the keyword rule_eval. Below is an example log.
Correct Log: As seen in the log, both $A and $B have obtained corresponding values, and the expression returns true, indicating that the expression is satisfied.

Error Log: The log shows that the result is false, indicating that the expression conditions are not met. Additionally, it shows that there are two false returns even though only one alert calculation condition was configured. This is likely due to data labels being inconsistent, causing the query analysis statements to be treated as two different curves. As a result, the alert calculation conditions are not met, and the alert cannot be triggered properly.


