Log Collection & Storage
For ES storage deployment and log collection reporting, please refer to this document.
Elasticsearch Data Source Configuration
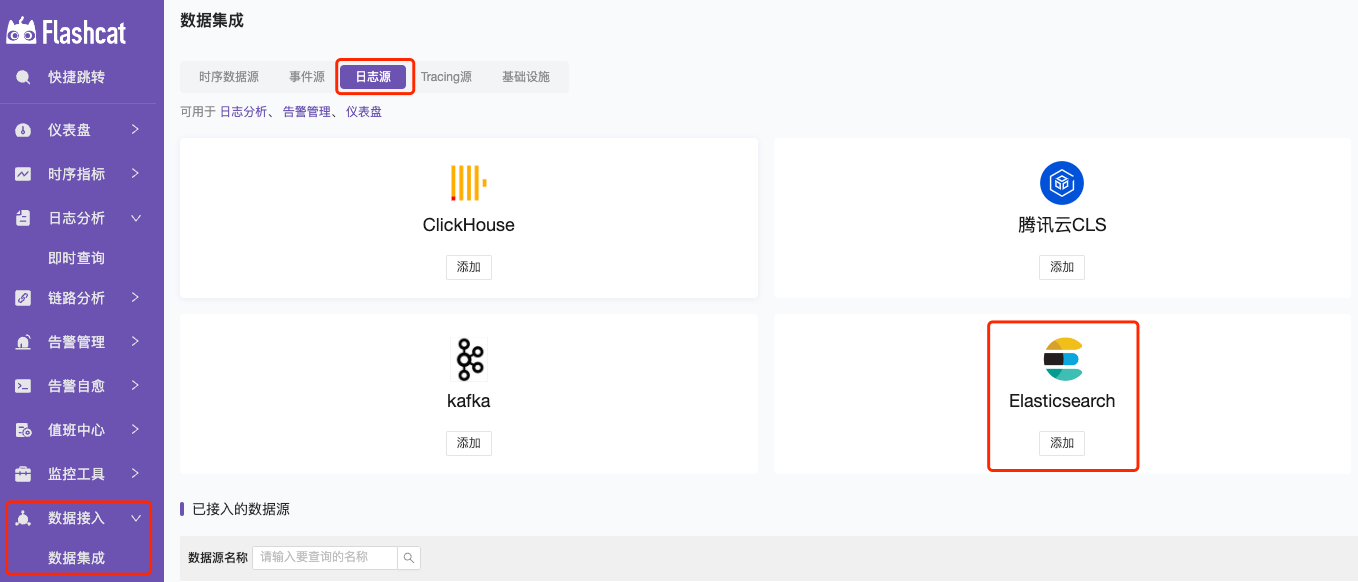
Data Source Name - Name: The identifier name of the Elasticsearch data source;
HTTP - URL: Elasticsearch service address; Example: http://server-ip:9200
HTTP - Timeout (unit: ms): Connection service timeout;
Authorization - Username & Password: Elasticsearch authorization username and password;
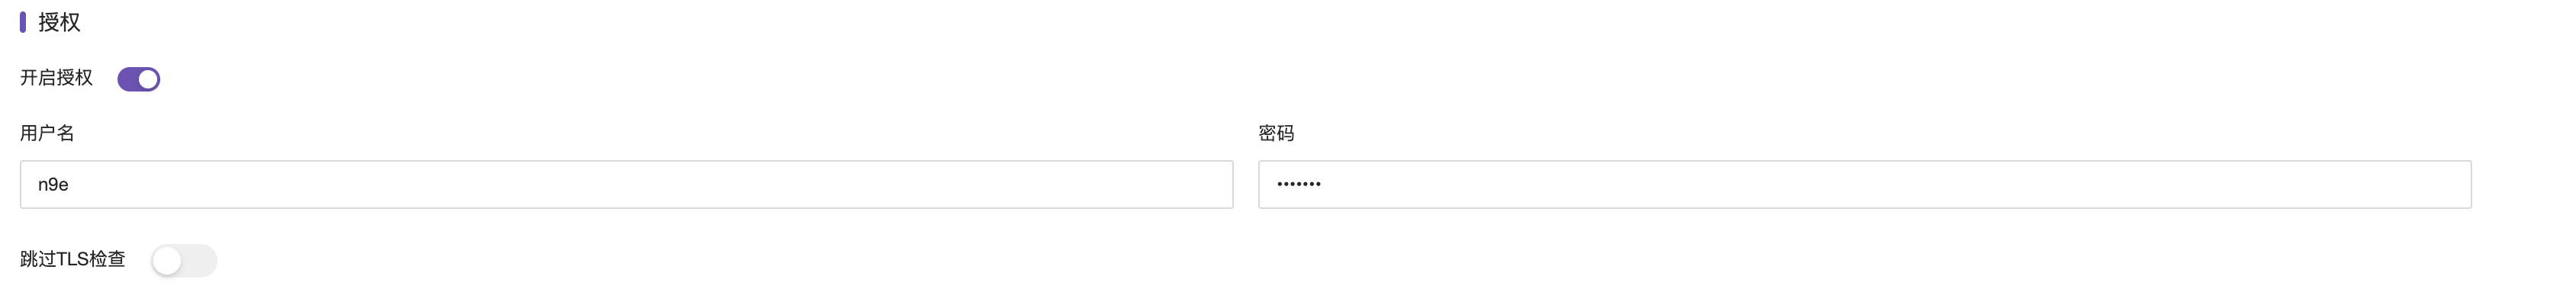
Elasticsearch can create and query users via your_path/bin/elasticsearch-users list|useradd. You can also view and manage users via the GET /_security/user or in Kibana’s management interface.
Custom HTTP Headers - Header & Value: Configure the validation parameters for requesting the Elasticsearch interface;
ES Details - Version & Maximum Concurrent Shard Requests
If the number of shards in the cluster is very high, the unconfigured maximum concurrent shard requests may cause high memory usage, increased CPU load, increased latency, etc. In this case, setting the maximum concurrent shard requests is very necessary. You can query the set maximum concurrent shard requests via the Elasticsearch command curl -X GET http://server_ip:port/_cat/shards?v.
Minimum Time Interval (s): The lower limit of automatic grouping by time interval. It is recommended to set it to the writing frequency. For example, if data is written every minute, set it to 1m.
Write Configuration - Allow Writing (Commercial Feature)
This feature is similar to the Remote Write in the Prometheus data source. Once enabled, log extraction data can be written back to the ES node;
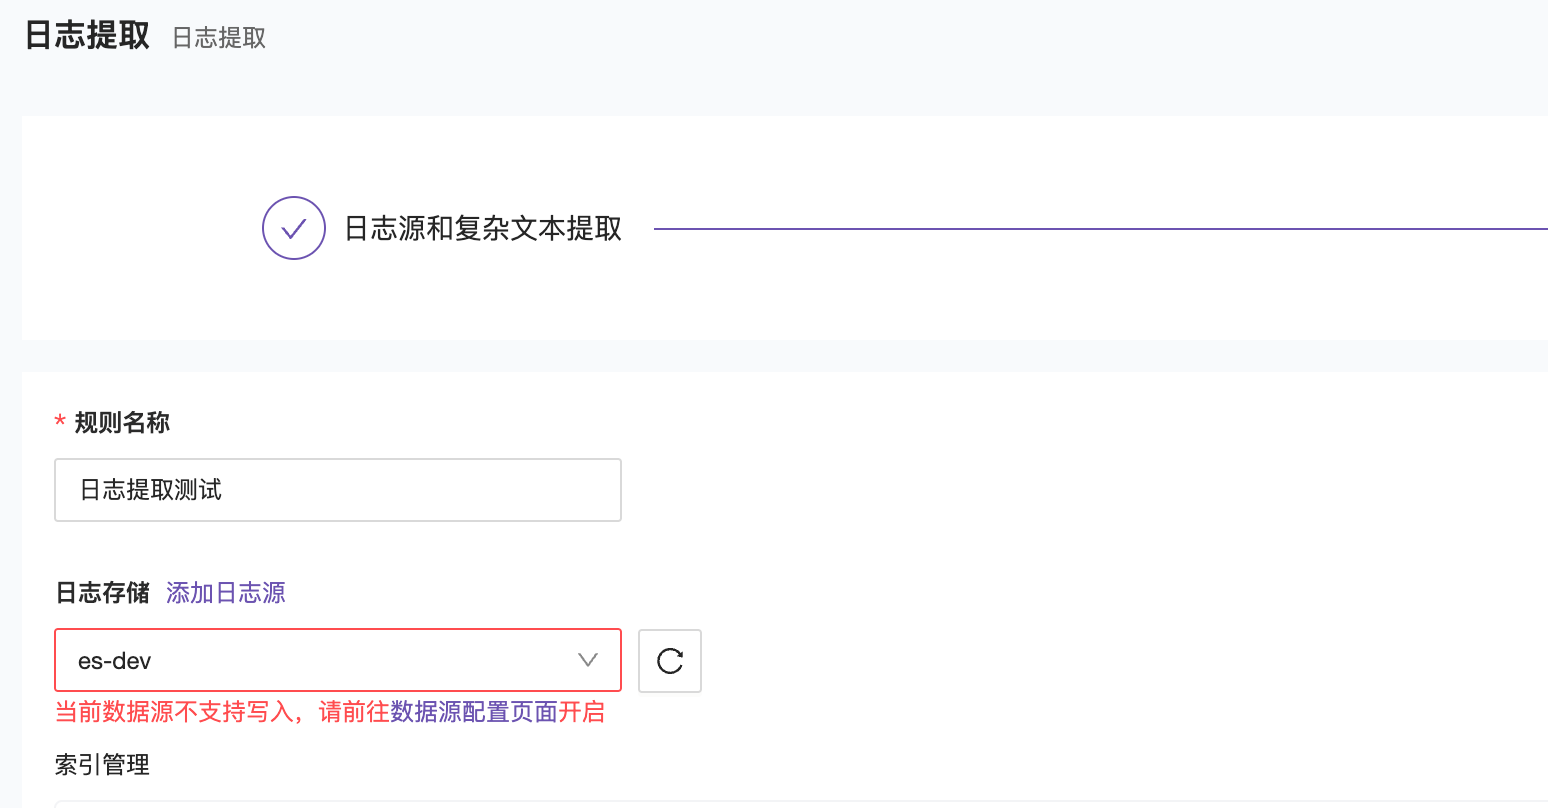
After enabling write permission, data can be written normally.
Bind to Alarm Engine Cluster: Configure the data source to bind to the specified alarm engine;
How to Query Data
- Log Query - Instant Query —> 2. Select the corresponding ES data source —> 3. Select the query syntax —> 4. Enter the query statement
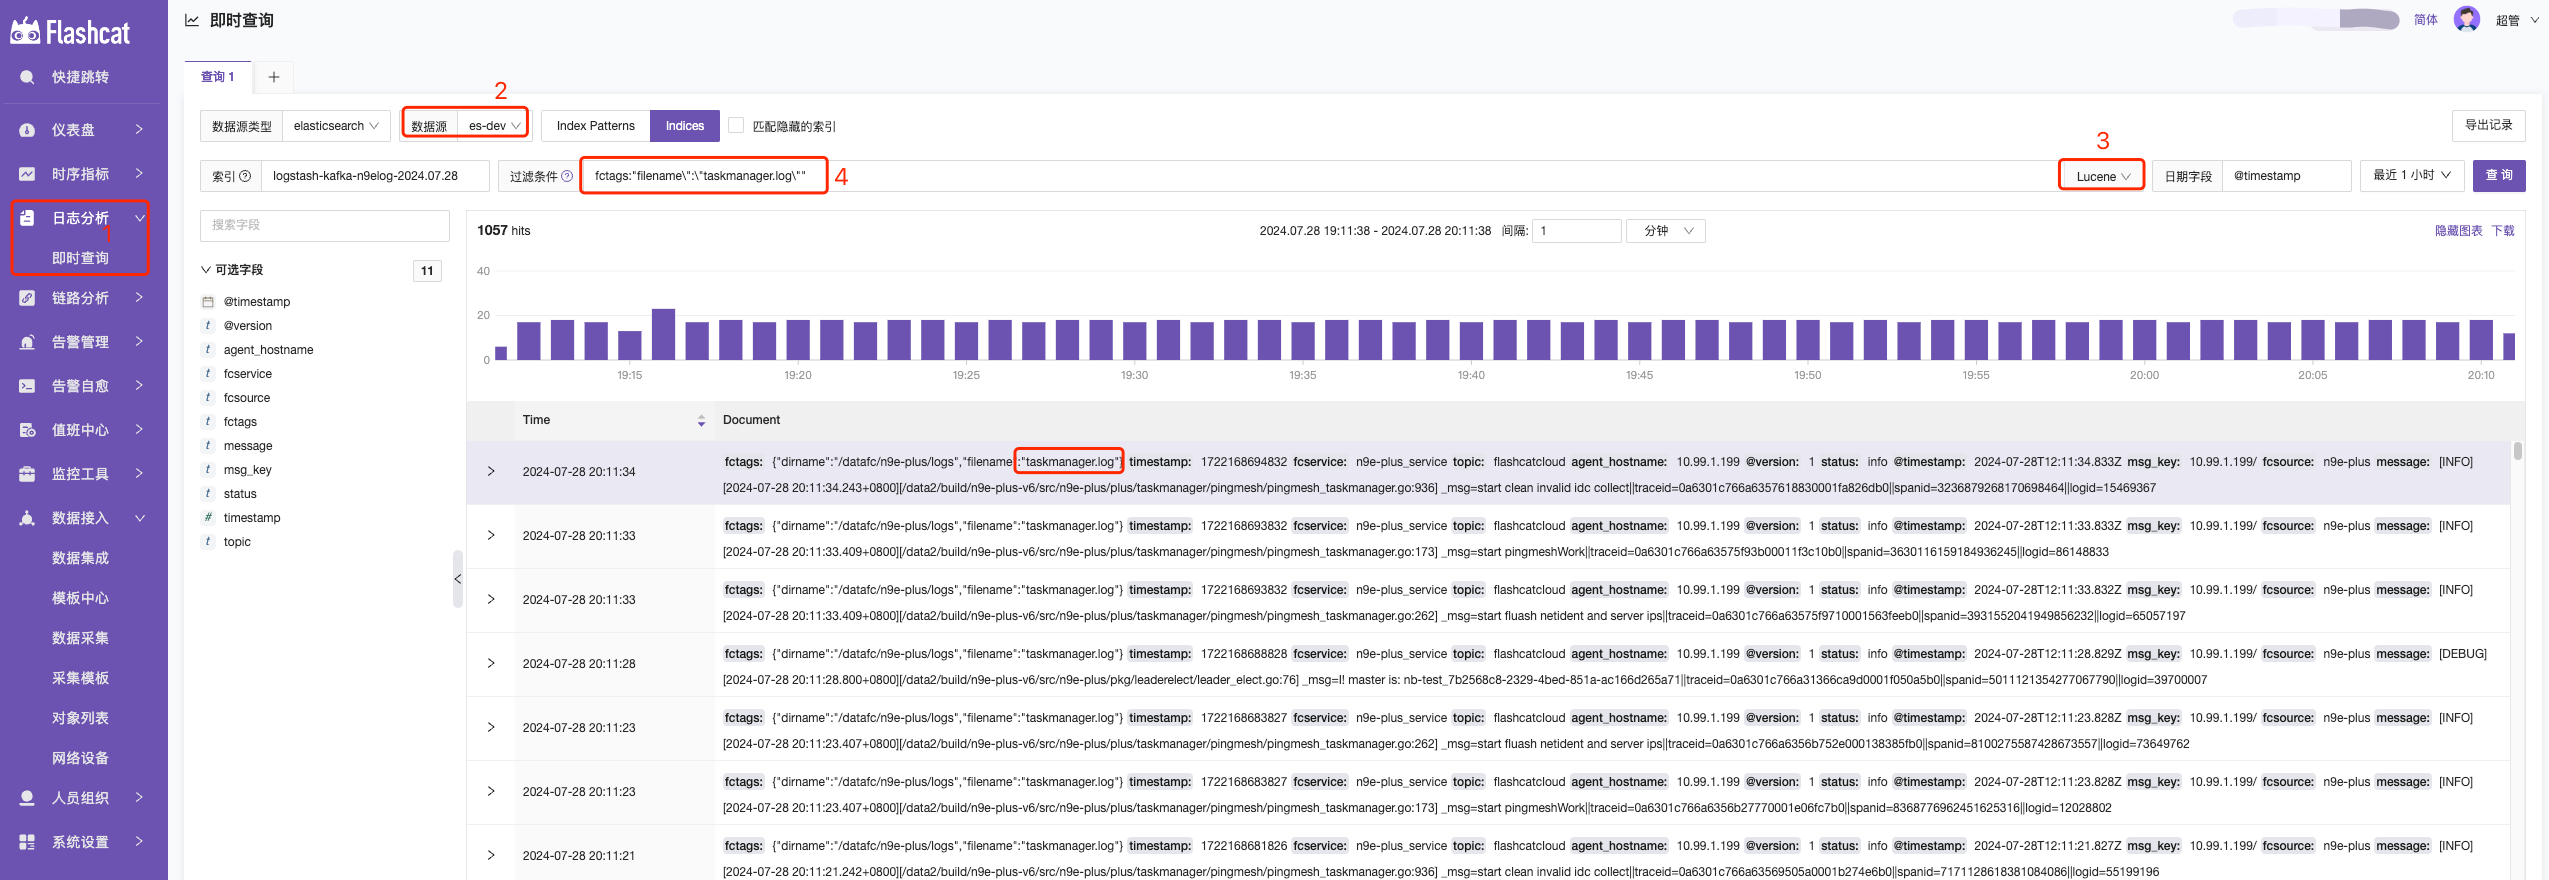
- KQL: A simple text-based query language for filtering data. KQL only filters data and does not aggregate, transform, or sort data. KQL Official Syntax Introduction
- Lucene: The main reason for using Lucene syntax is to use advanced Lucene features such as regular expressions or fuzzy term matching. However, Lucene syntax cannot search nested objects or script fields. Lucene Official Syntax Introduction
How to Configure ES Log Alarms
The log type and the general metric alarm rules are very similar, with the only difference being the setting of the alarm conditions. Metric alarm rules use PromQL as the query condition, while log type alarm rules use boolean expressions as the query condition. These alarm conditions (such as A, B, etc.) need to be obtained through query statistics.
When configuring query statistics, it is found to be similar to the ES Log Instant Query. First, select the index and query conditions as well as the date field. There are also two additional data field groups: Numerical Extraction and Group By.
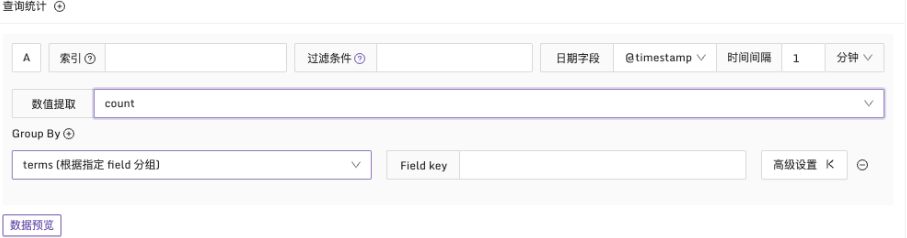
To get numerical type results, use numerical extraction and select the appropriate statistical function. In addition to common functions such as count, sum, avg, min, max, there are also percentile value functions like p90, p95, p99.
Additionally, by configuring Group By, results can be grouped based on specific fields. This will generate multiple time series and, if the alarm conditions are met, produce multiple anomaly points, generating multiple alarm events.
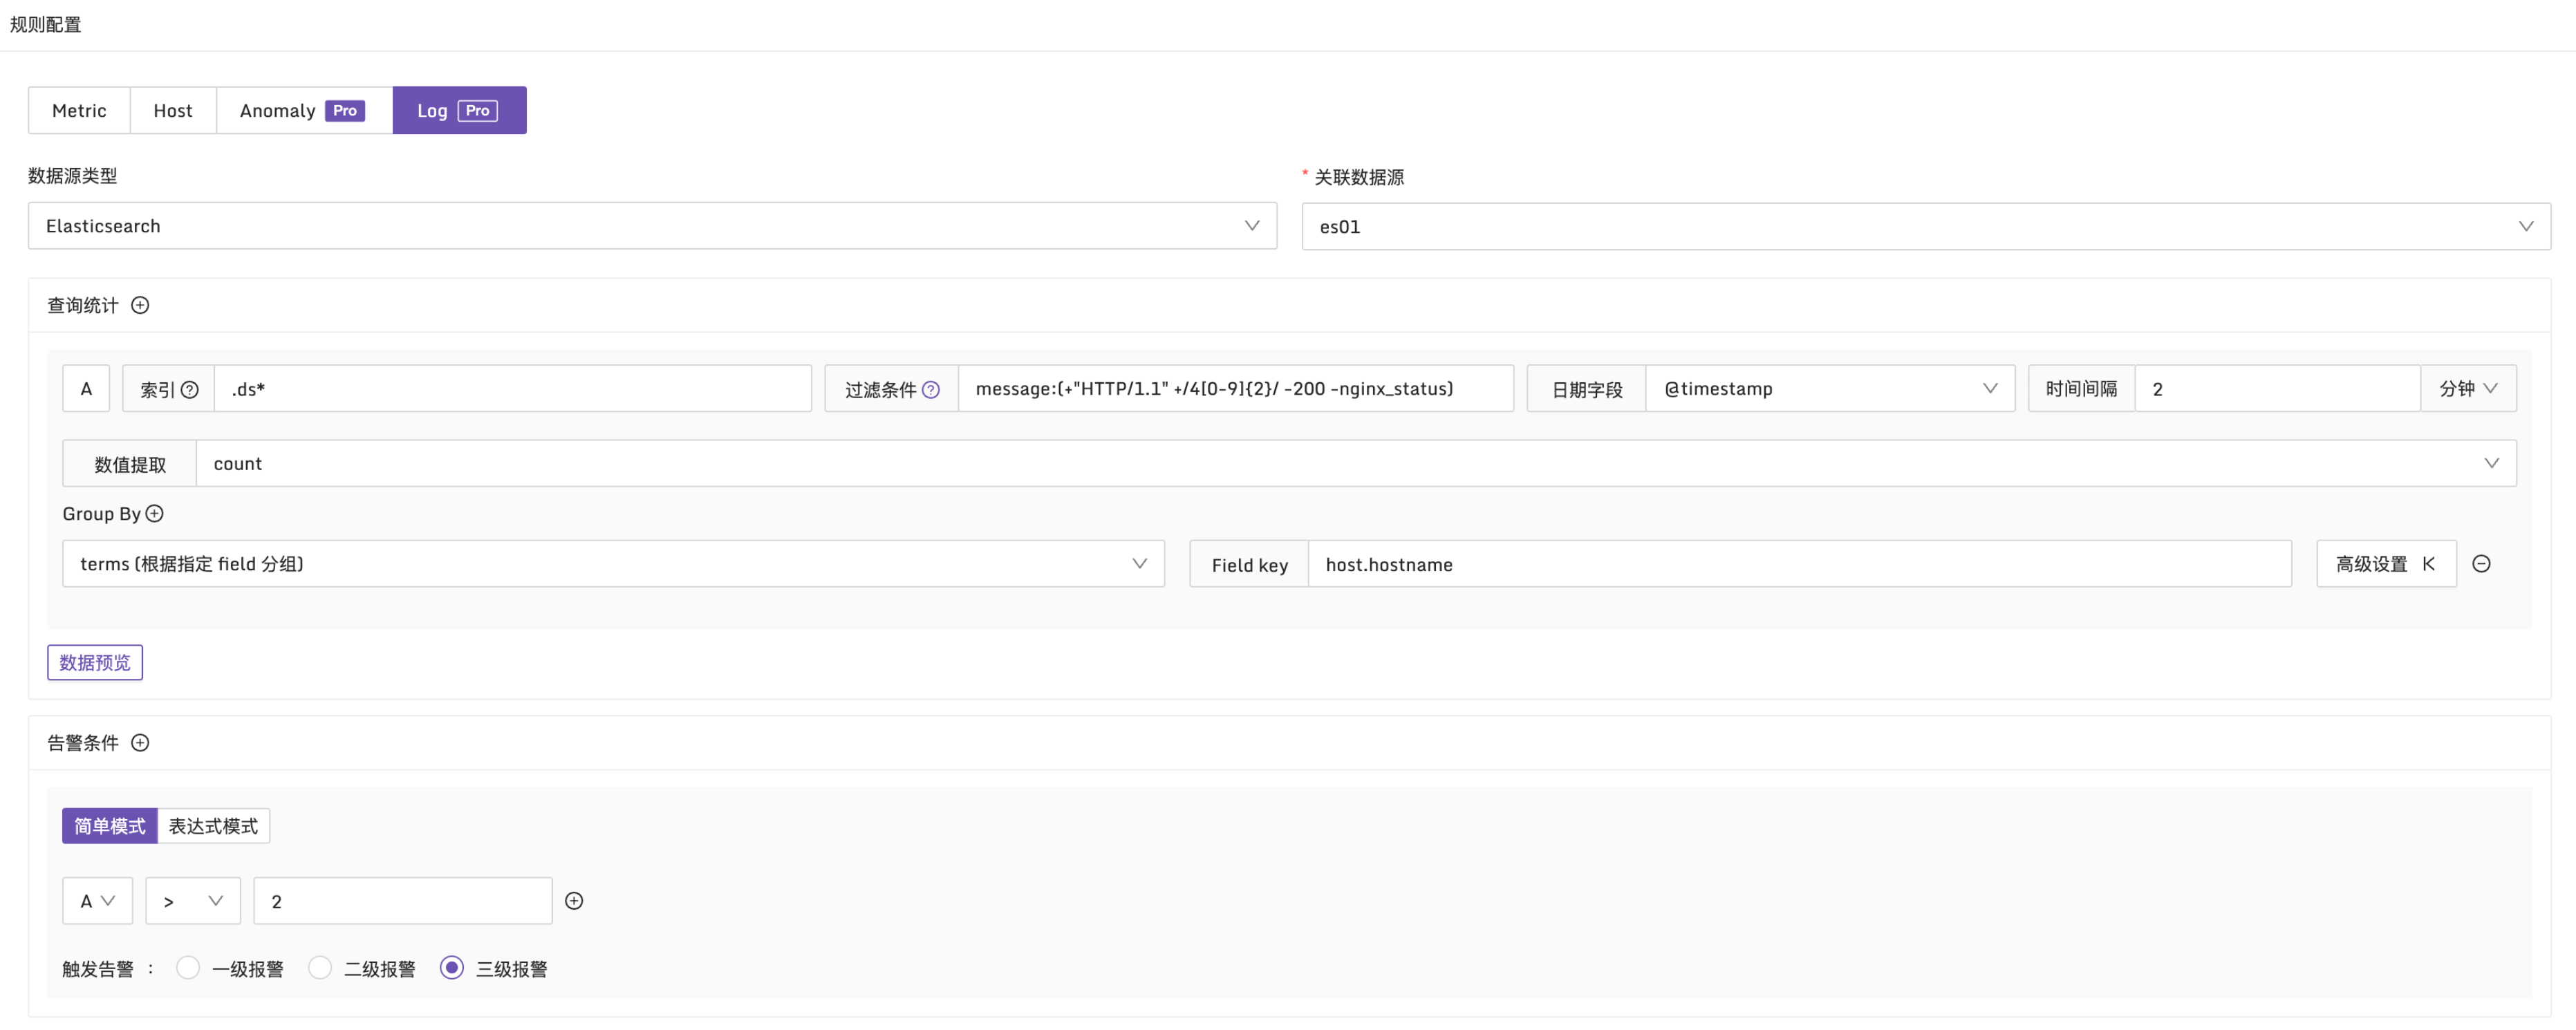
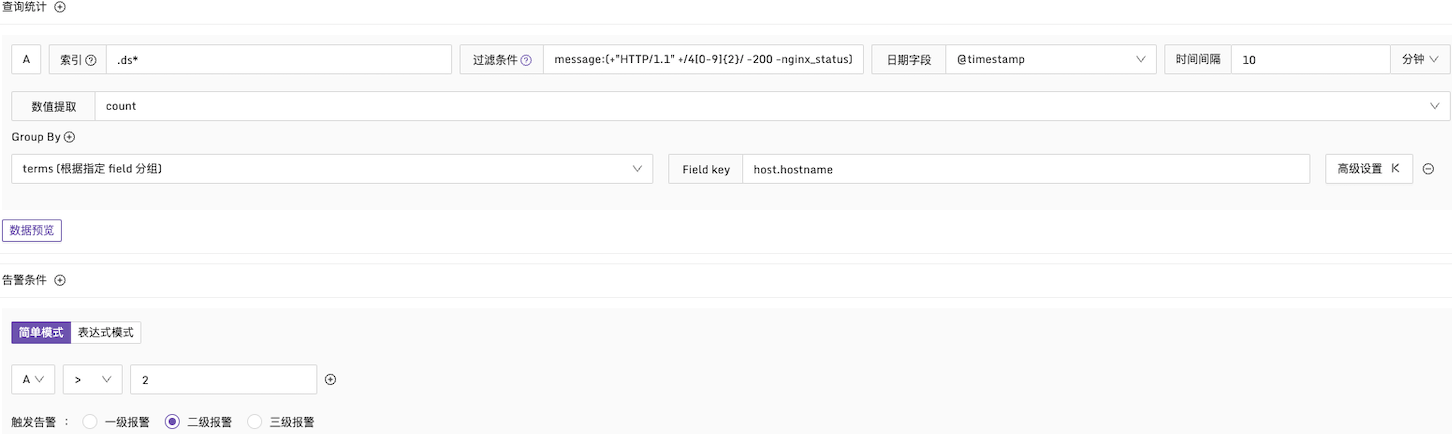
Example 1: Alarm Condition for HTTP CODE 4xx
Explanation: In a 10-minute time period, check the message field in the log. If the number of 4xx logs exceeds 2, an alarm is generated, and statistics are grouped by the host.hostname field. Configuration is as follows:
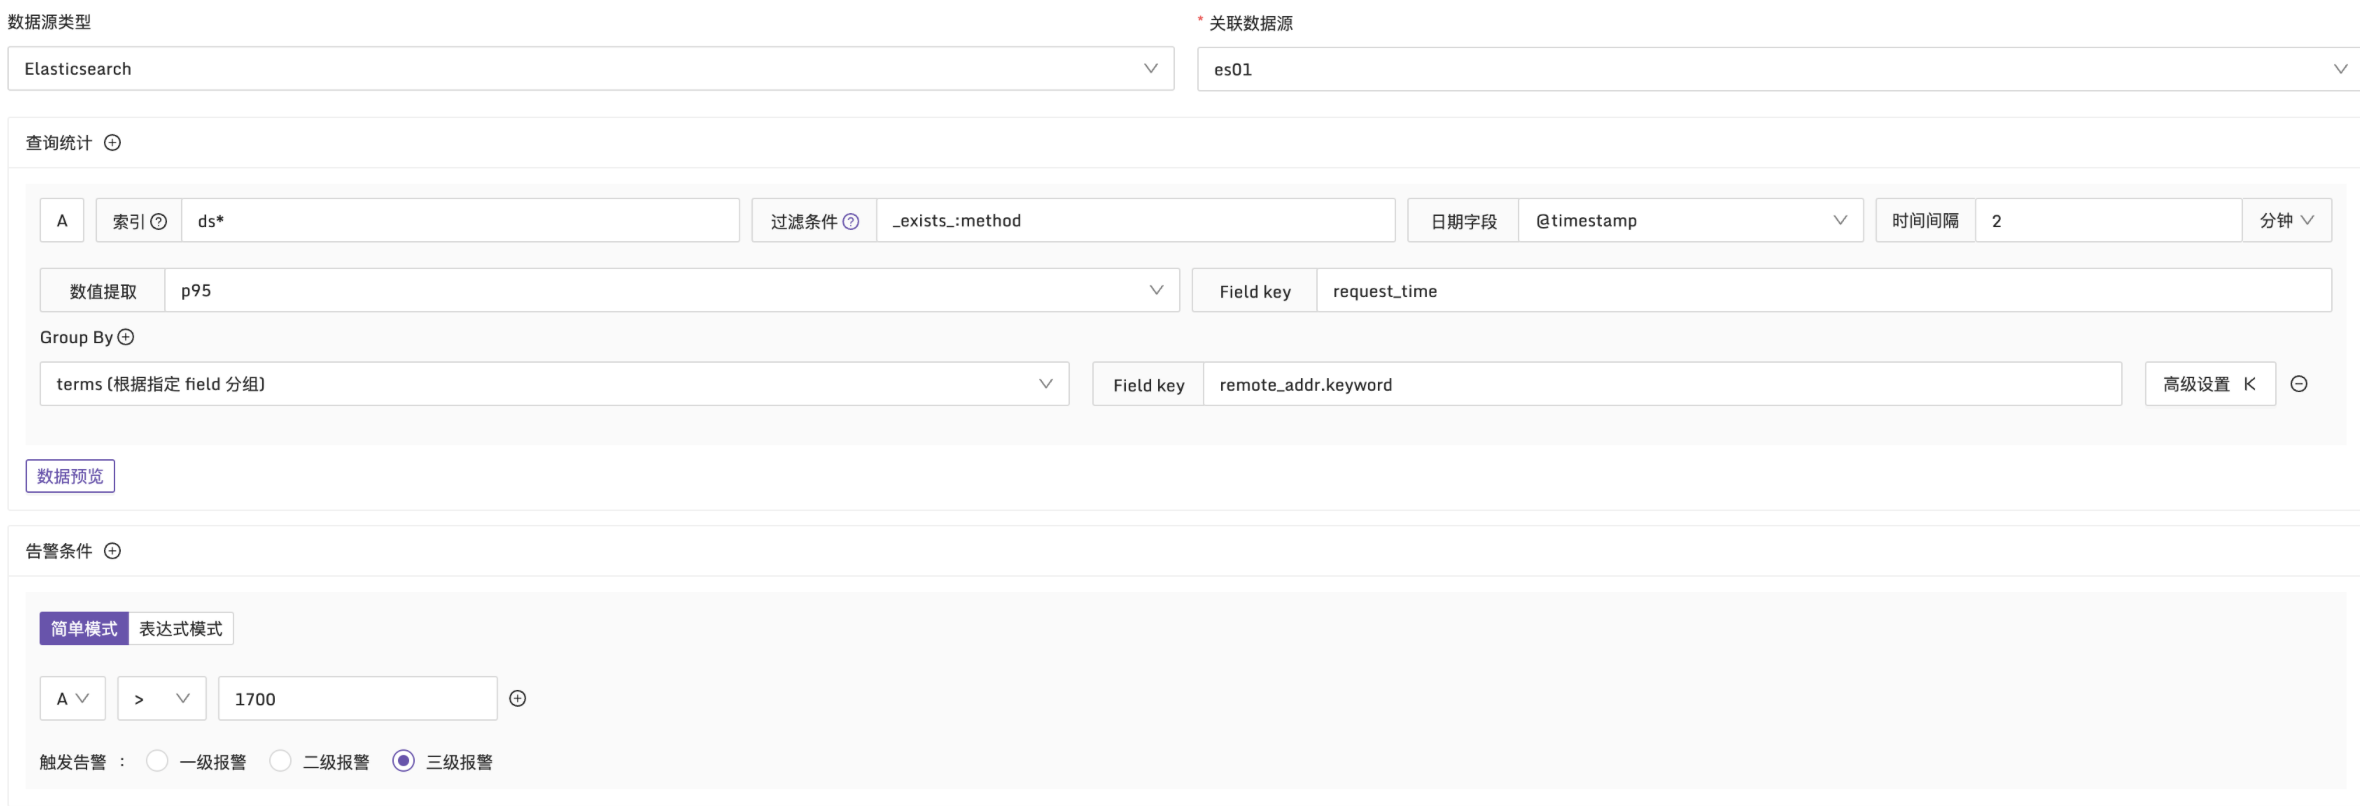
Example 2: Alarm when the 95th Percentile of Request Time Exceeds 1700ms
Explanation: In a 2-minute time period, use the p95 function to statistically analyze the request_time in the log. Group by remote_addr dimension and check if there are request times exceeding 1700ms. Configuration is as follows:
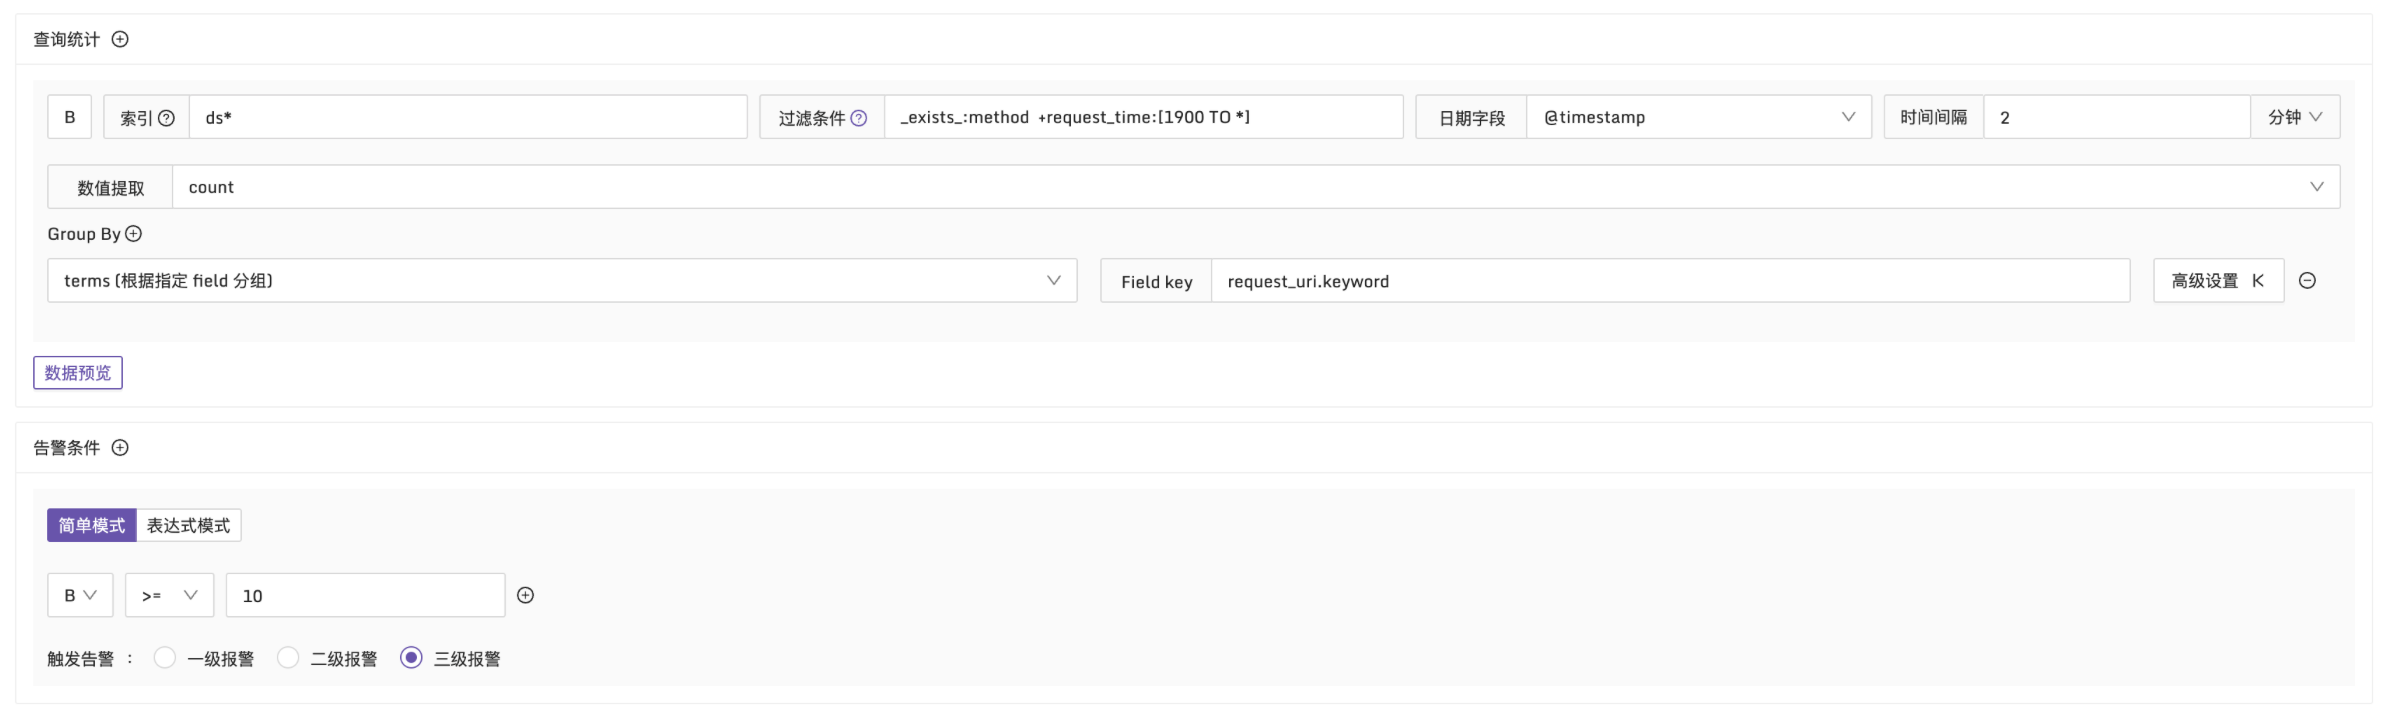
Example 3: Alarm When Request Time Greater Than 1900ms and More Than 10 Logs Match
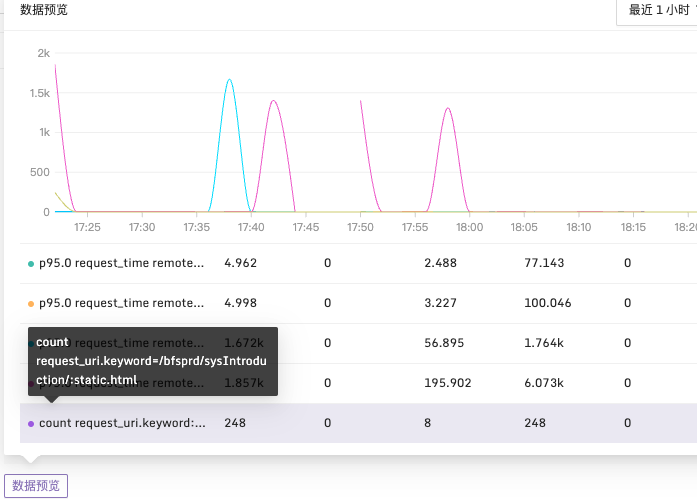
Explanation: In a 2-minute time period, filter logs with request_time greater than 1900ms. Group by request_uri dimension and check if the number of logs exceeds 10. Configuration is as follows:
After configuring the required data fields, you can also preview the query results using the data preview button.