


In the log analysis, select instant query and choose the Elasticsearch data source to query logs.
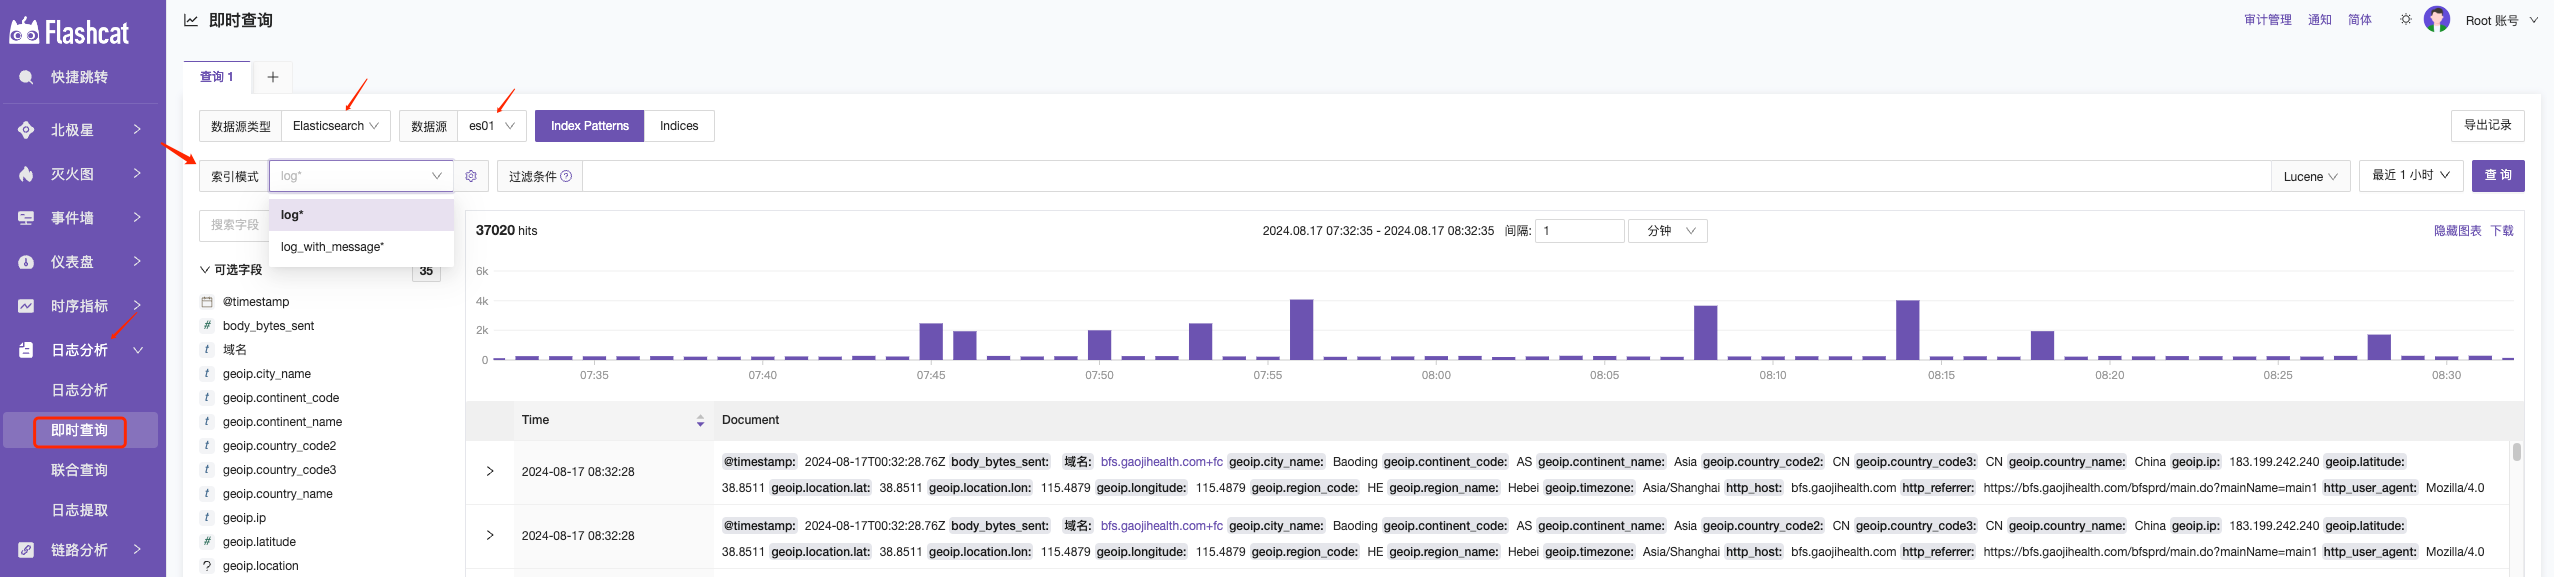
Here are some usage examples:
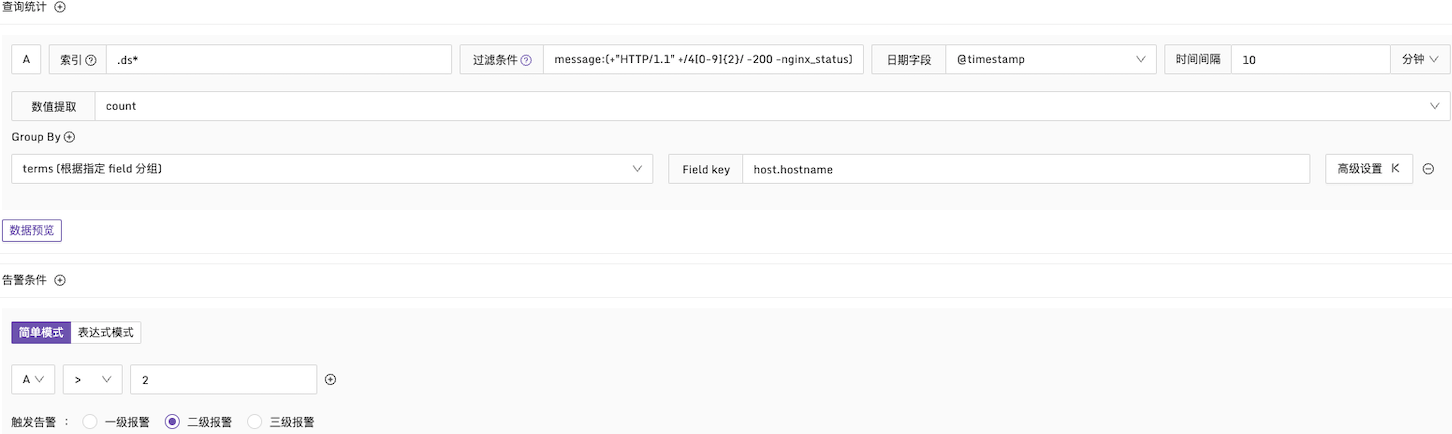
Example 1: Alert condition for HTTP CODE 4xx
Description: Check the message field in the logs within every 10-minute interval. If the number of 4xx logs exceeds 2, an alert is triggered. The logs are grouped by the host.hostname field. The configuration is as follows:
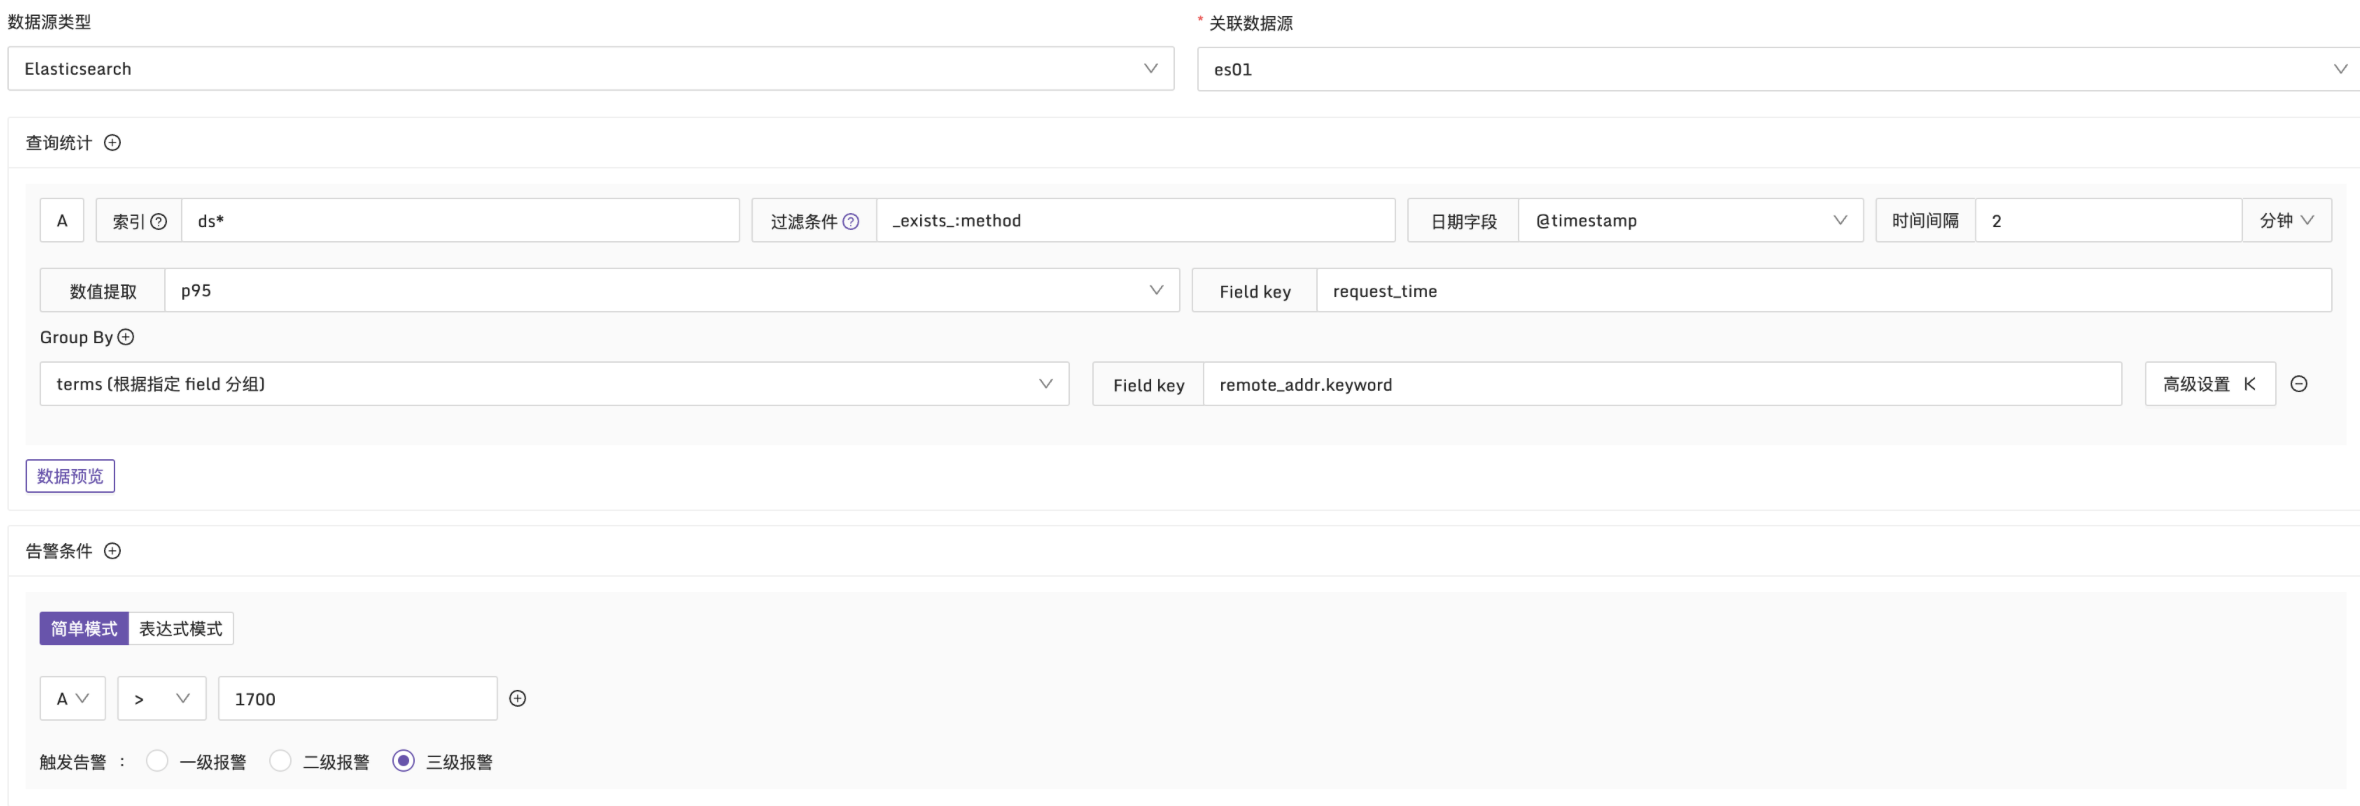
Example 2: Trigger an alert when the 95th percentile of request duration exceeds 1700ms
Description: Within every 2-minute interval, use the p95 function to calculate the request_time in the logs. The logs are grouped by the remote_addr dimension to check if any request duration exceeds 1700ms. The configuration is as follows:
Example 3: Trigger an alert when more than 10 logs have request_time greater than 1900ms
Description: Within every 2-minute interval, filter logs with request_time greater than 1900ms. The logs are grouped by the request_uri dimension, and an alert is triggered if the number of logs exceeds 10. The configuration is as follows:


