夜莺-Nightingale
夜莺V6
项目介绍
架构介绍
快速开始

黄埔营
安装部署
升级
采集器
使用手册
API
数据库表结构
alert_aggr_view
alert_cur_event
alert_his_event
alert_mute
alert_rule
alert_subscribe
alerting_engines
board
board_payload
builtin_cate
busi_group
busi_group_member
chart_share
configs
datasource
metric_view
notify_tpl
recording_rule
role
role_operation
sso_config
target
task_record
task_tpl
task_tpl_host
user_group
user_group_member
users
FAQ
转发数据给多个时序库
机器列表数据异常
数据流图
监控数据时有时无
查询原始监控数据
快捷视图详解
告警自愈模块使用
仪表盘里只展示我的机器
仪表盘里图表数据缺失
设置自定义告警通知方式
target_up指标的问题
夜莺可以监控 x 么
告警和恢复的判断逻辑
容量规划问题
connection refused
登录与认证
数据采集器Categraf
日志写到`/var/log/messages`
告警规则&告警模板如何引用变量
采集到的数据是字符串怎么处理
管理员密码忘记了
制作大盘如何添加图片
添加loki数据源报错
v6小版本升级有什么 sql 要执行吗
机器列表有展示,但采集数据查询不到
n9e 启动异常报错
n9e集群部署配置修改
告警触发/恢复的值怎么获取
推送 Promethus 报错 OOO
机器列表怎么忽略云资源
告警规则仅在本业务组生效失败
categraf 启动 oracle 插件报错
告警自愈不生效
n9e查询时序库EOF报错
手动编译项目报错
promQL 使用函数标签信息丢失
内存使用率+可用率不等于100
夜莺仪表盘有哪些内置变量
categraf配置文件支持热加载吗
导入 Grafana 仪表盘无效数据源
如何查看报错消息
采集器-Categraf
开源生态
Telegraf
Prometheus
版权声明
第1章:天降奇兵
第2章:探索PromQL
开篇
理解时间序列
Metrics类型
初识PromQL
PromQL操作符
PromQL聚合操作
PromQL内置函数
在HTTP API中使用PromQL
最佳实践:4个黄金指标和USE方法
小结
第3章:Prometheus告警处理
开篇
Prometheus告警简介
自定义Prometheus告警规则
部署Alertmanager
Alertmanager配置概述
基于标签的告警处理路由
使用Receiver接收告警信息
告警模板详解
屏蔽告警通知
使用Recoding Rules优化性能
小结
第4章:Exporter详解
第5章:数据与可视化
第6章:集群与高可用
第7章:Prometheus服务发现
第8章:监控Kubernetes
开篇
初识Kubernetes
在Kubernetes下部署Prometheus
Kubernetes下的服务发现
使用Prometheus监控Kubernetes集群
基于Prometheus的弹性伸缩
小结
第9章:Prometheus Operator
参考资料
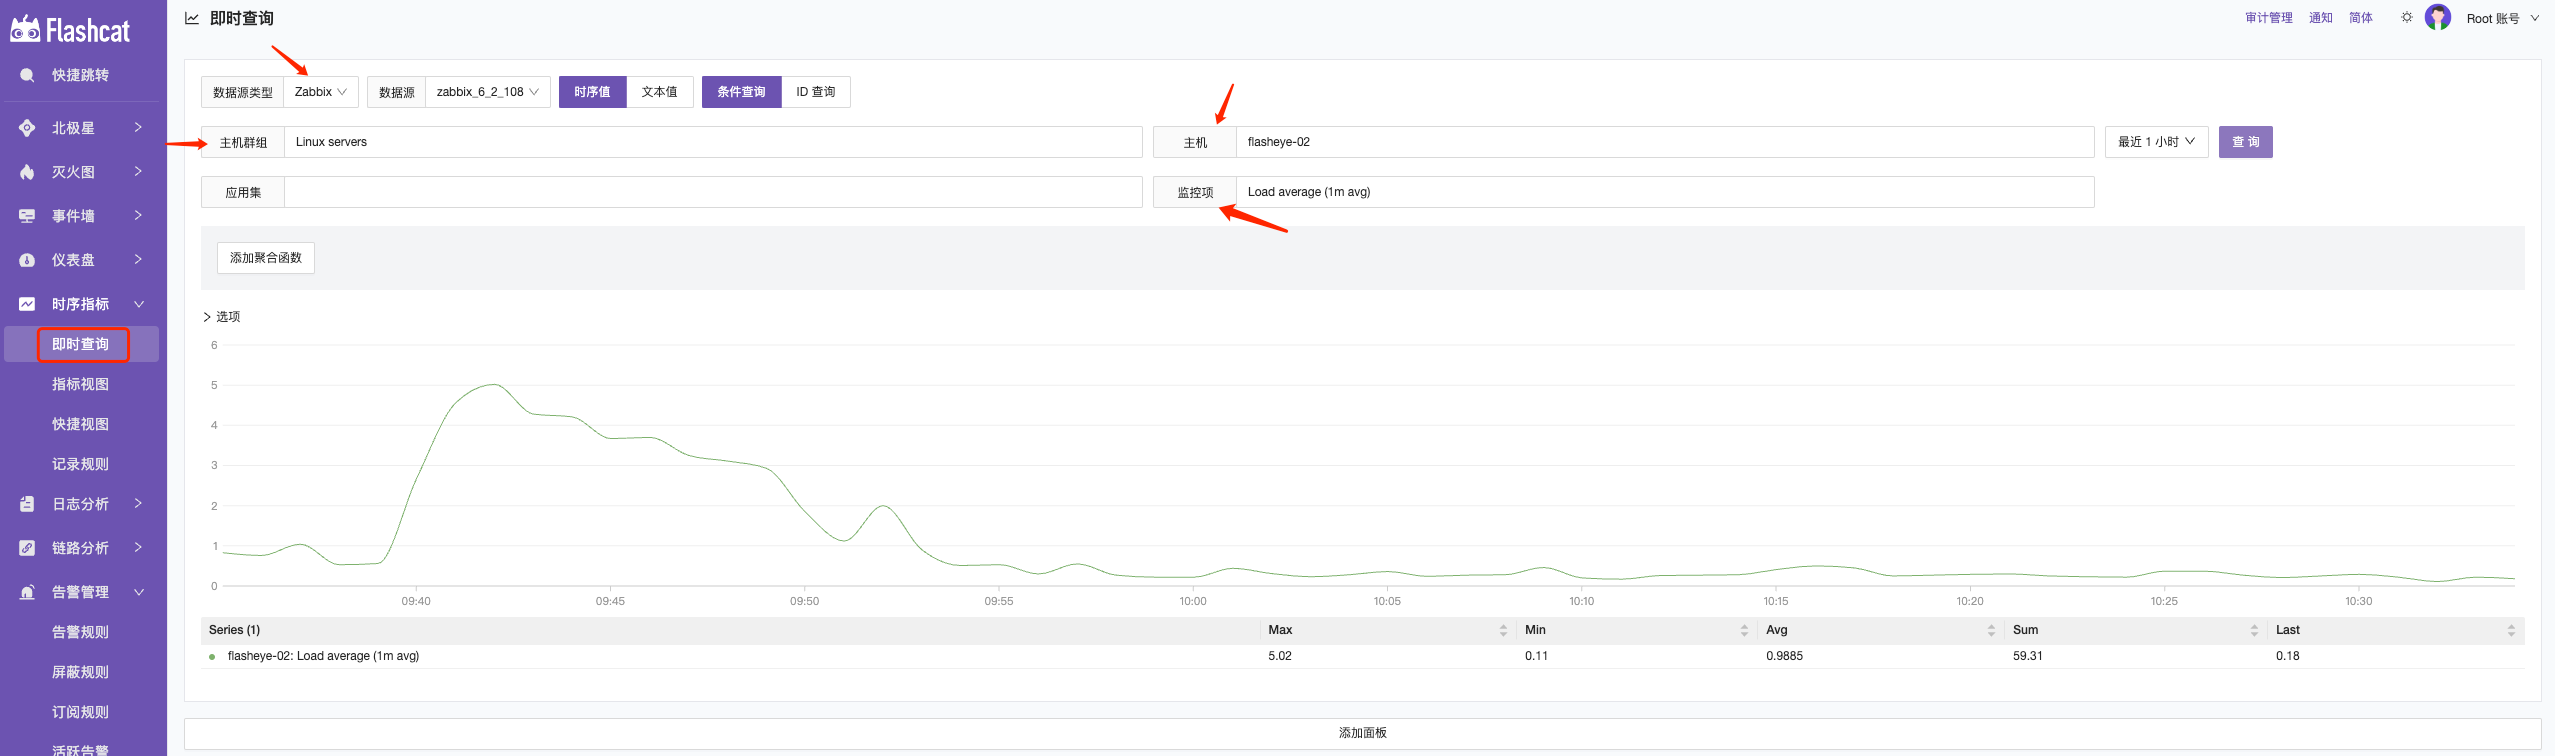
In the time-series metrics, select instant query, choose the Zabbix data source, and select the host group, host, and metric for querying.
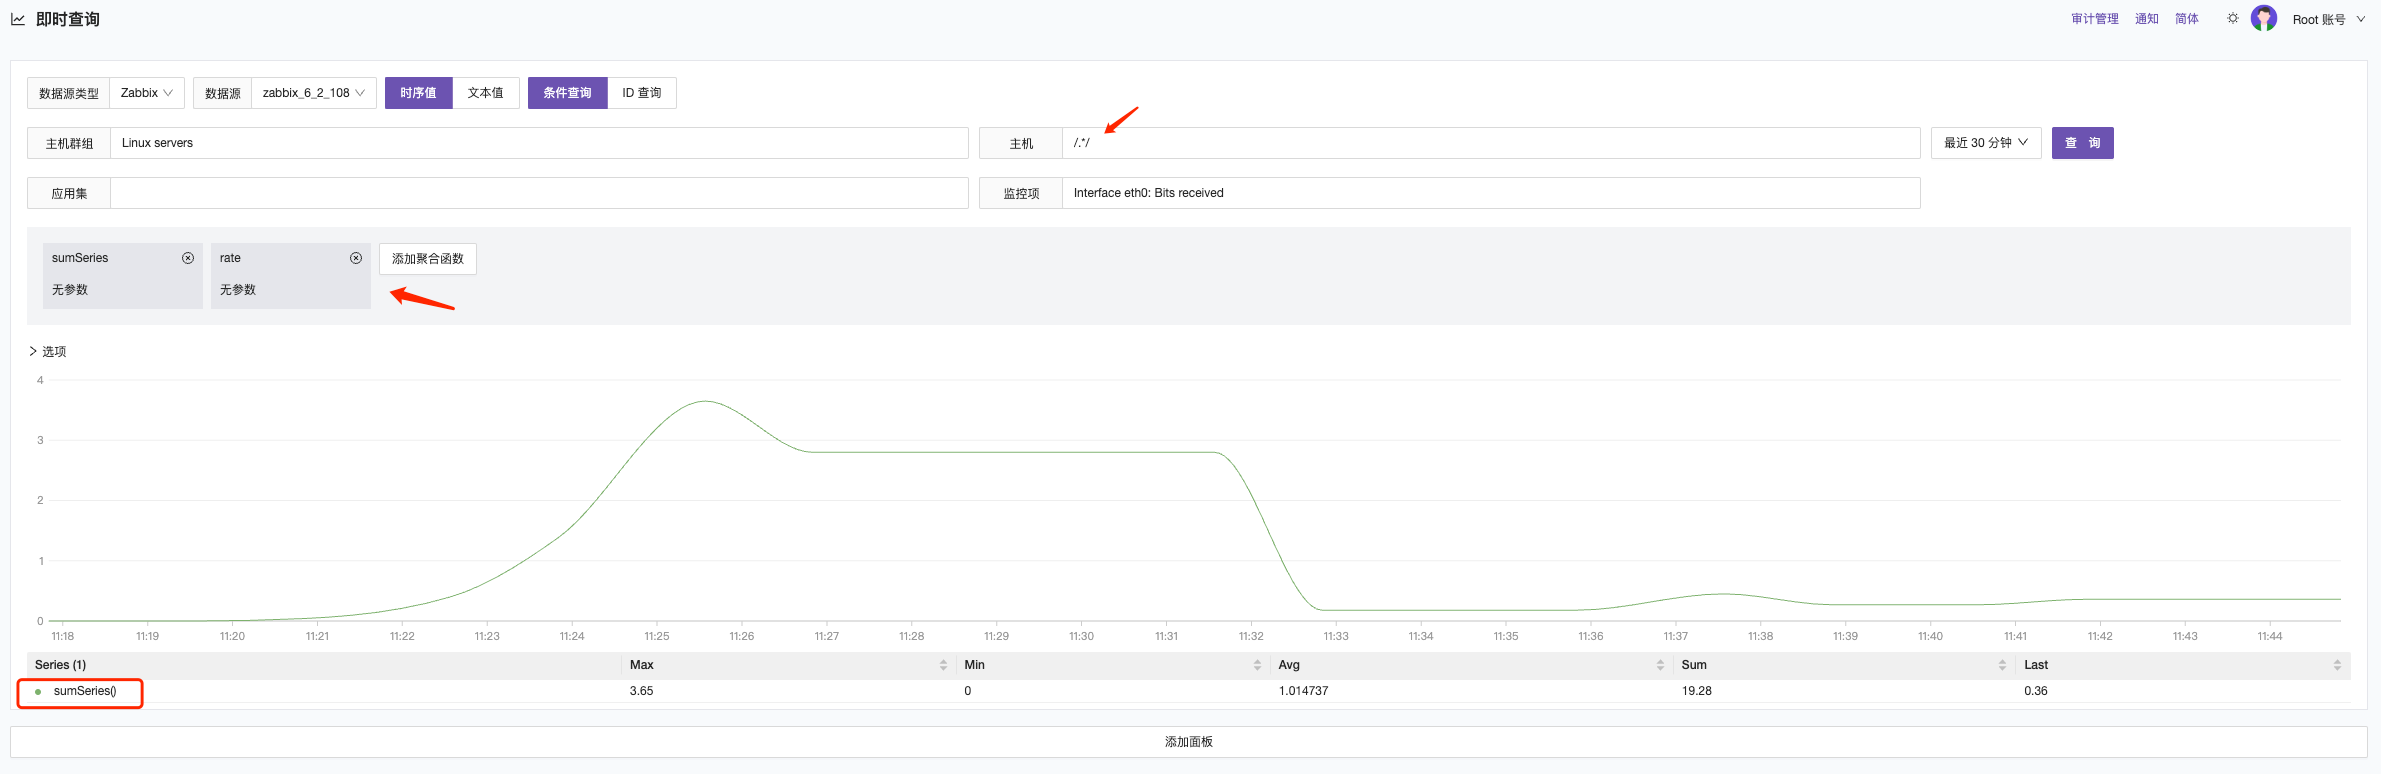
Query the aggregated traffic rate change across multiple hosts. Perform aggregation based on the Zabbix query results by first selecting a wildcard host and then choosing to add an aggregation function, as shown below:
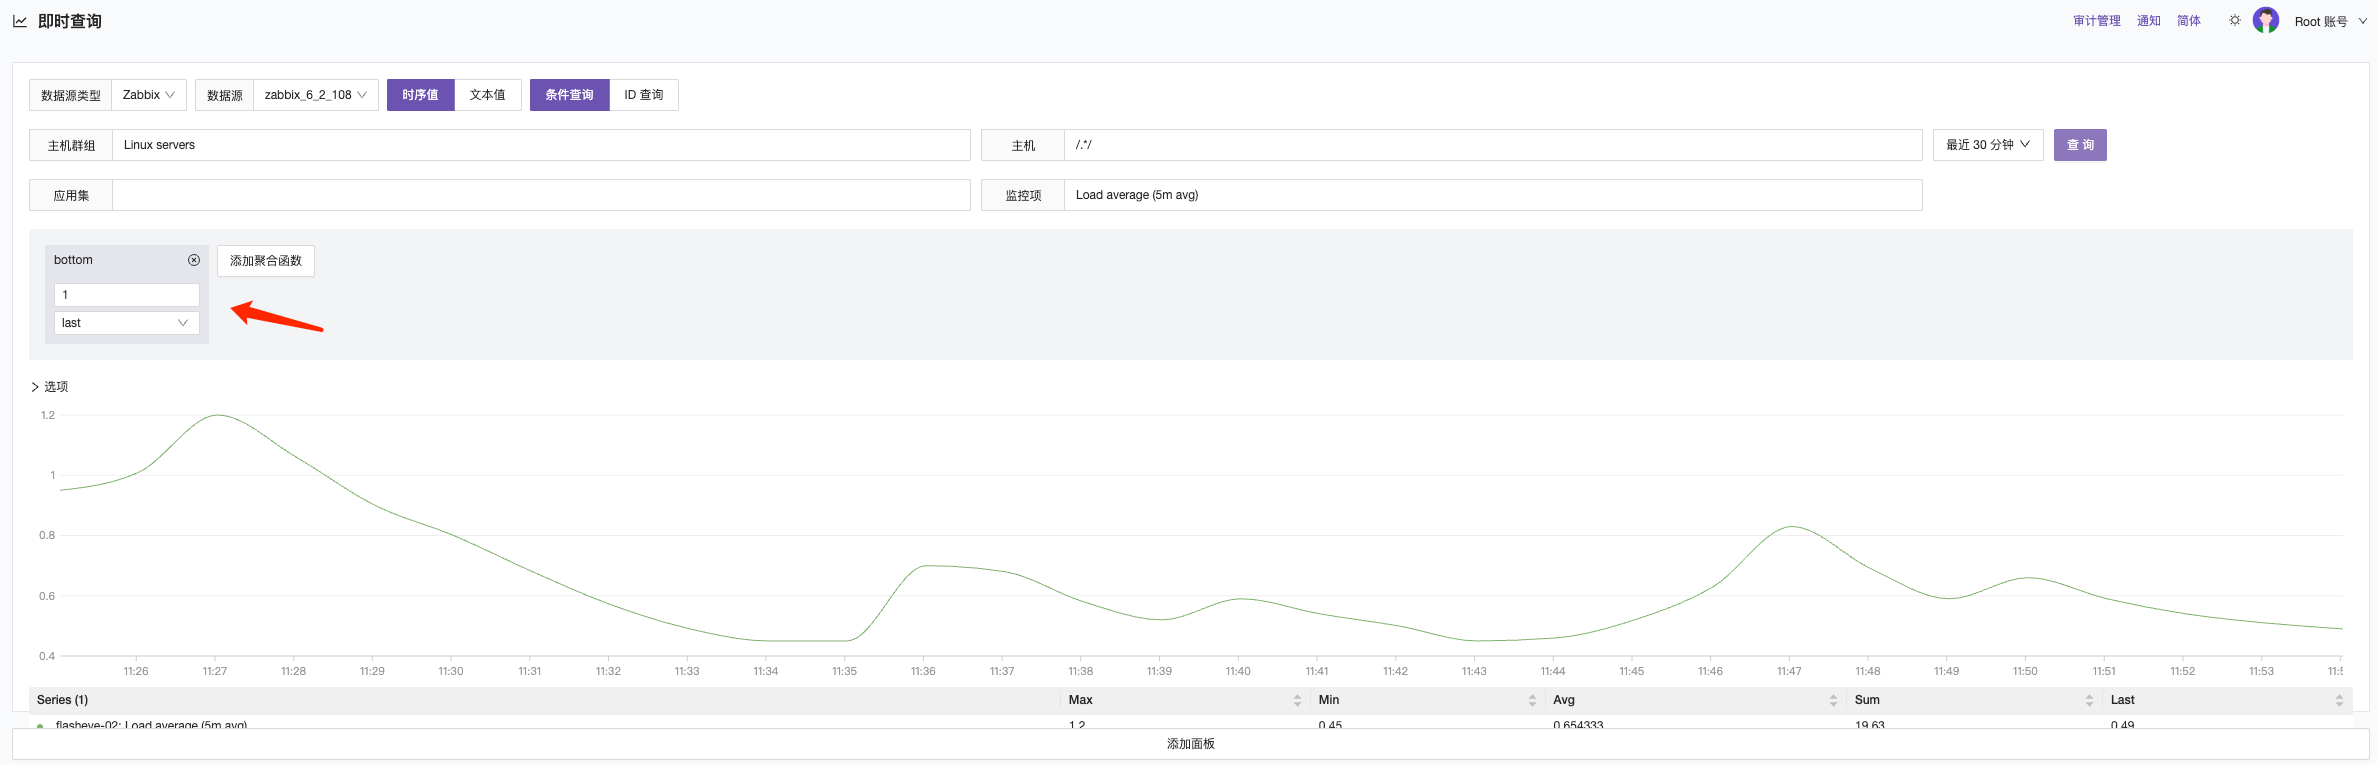
Query the minimum last value of the load metrics collected in the last 5 minutes for the host.