


Query Tables
Similar to logging into MySQL via the terminal and inputting an SQL query, for example, querying all data from a table:
select * from database_name.table_name limit 10
Query Time Series Chart
- You must use the
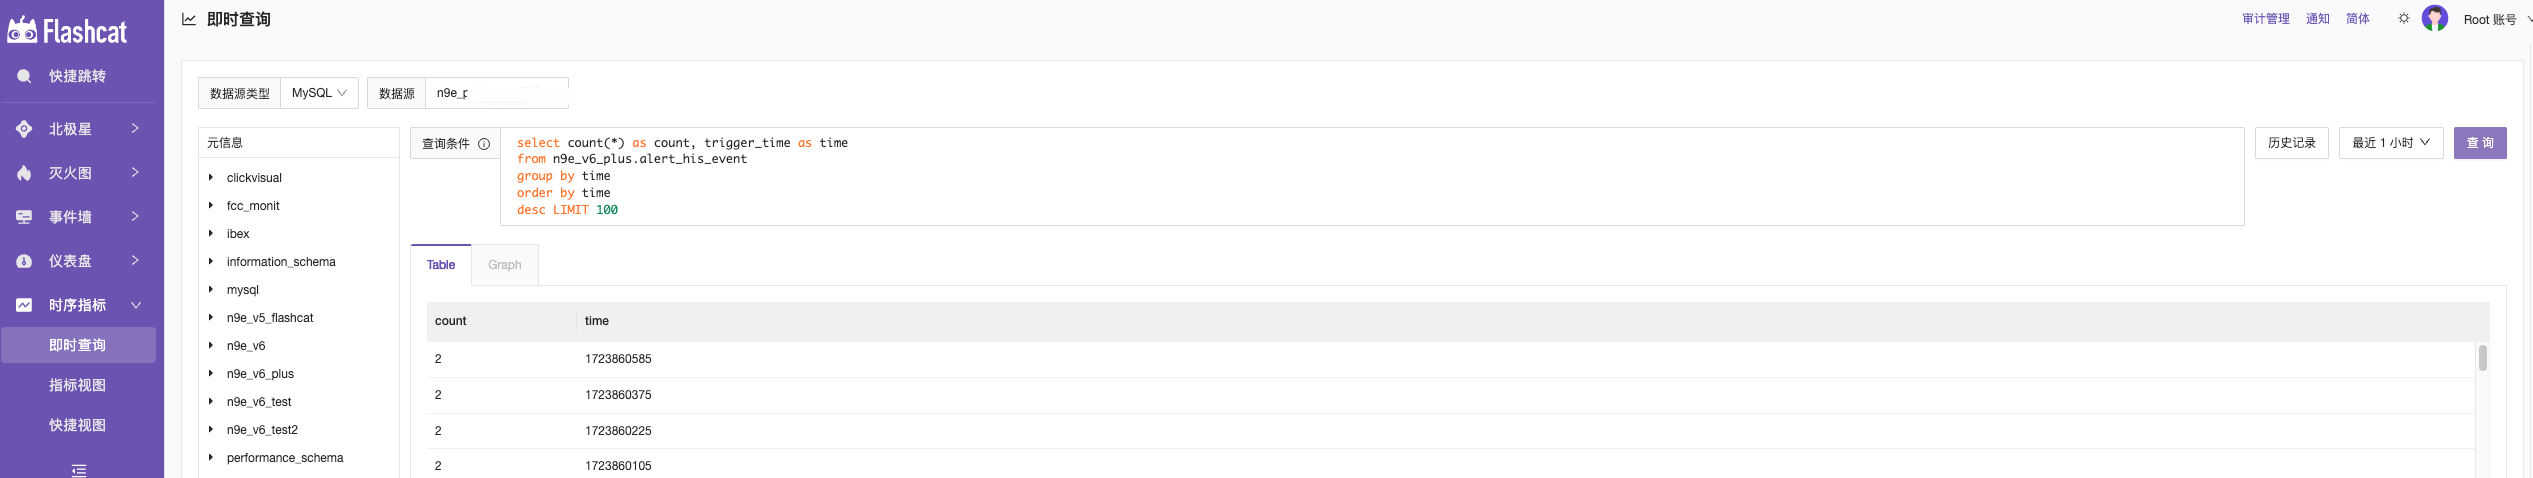
as timesyntax in SQL to specify which column is the time column, thengroup by time order by time descto sort by time, for example:
select count(*) as count, trigger_time as time
from n9e_v6_plus.alert_his_event
group by time
order by time
desc LIMIT 100
- You can use the
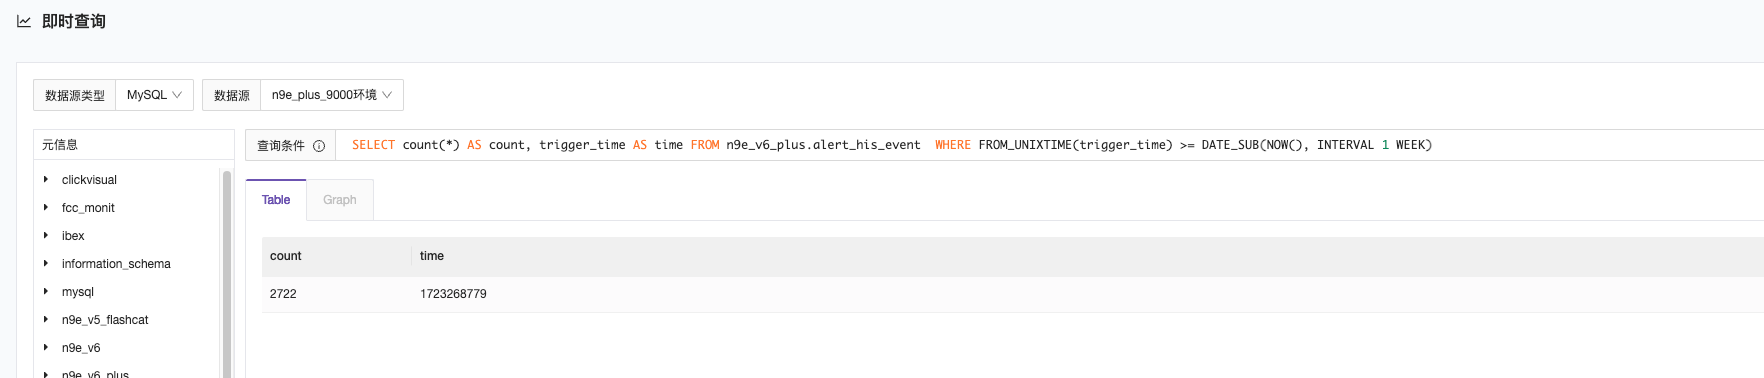
whereclause to query data from a specific time period, as shown in the following example:
2.1 Query data from the last minute. You can also replace WEEK with MINUTE, SECOND, HOUR, DAY, MONTH, etc.
SELECT count(*) AS count, trigger_time AS time FROM n9e_v6_plus.alert_his_event WHERE FROM_UNIXTIME(trigger_time) >= DATE_SUB(NOW(), INTERVAL 1 WEEK)
2.2 Query data from a specific time period. If trigger_time is a Unix timestamp (1720061167), the WHERE statement can directly write WHERE trigger_time >= 1720060214 AND trigger_time < 1720061214 or trigger_time >= $__unixEpochFrom() AND trigger_time < $__unixEpochTo(). $__unixEpochFrom() represents the start Unix timestamp, and $__unixEpochTo() represents the end Unix timestamp.
SELECT count(*) AS count, trigger_time AS time
FROM n9e_v6_plus.alert_his_event
WHERE trigger_time >= $__unixEpochFrom() AND trigger_time < $__unixEpochTo()
GROUP BY time
ORDER BY time DESC

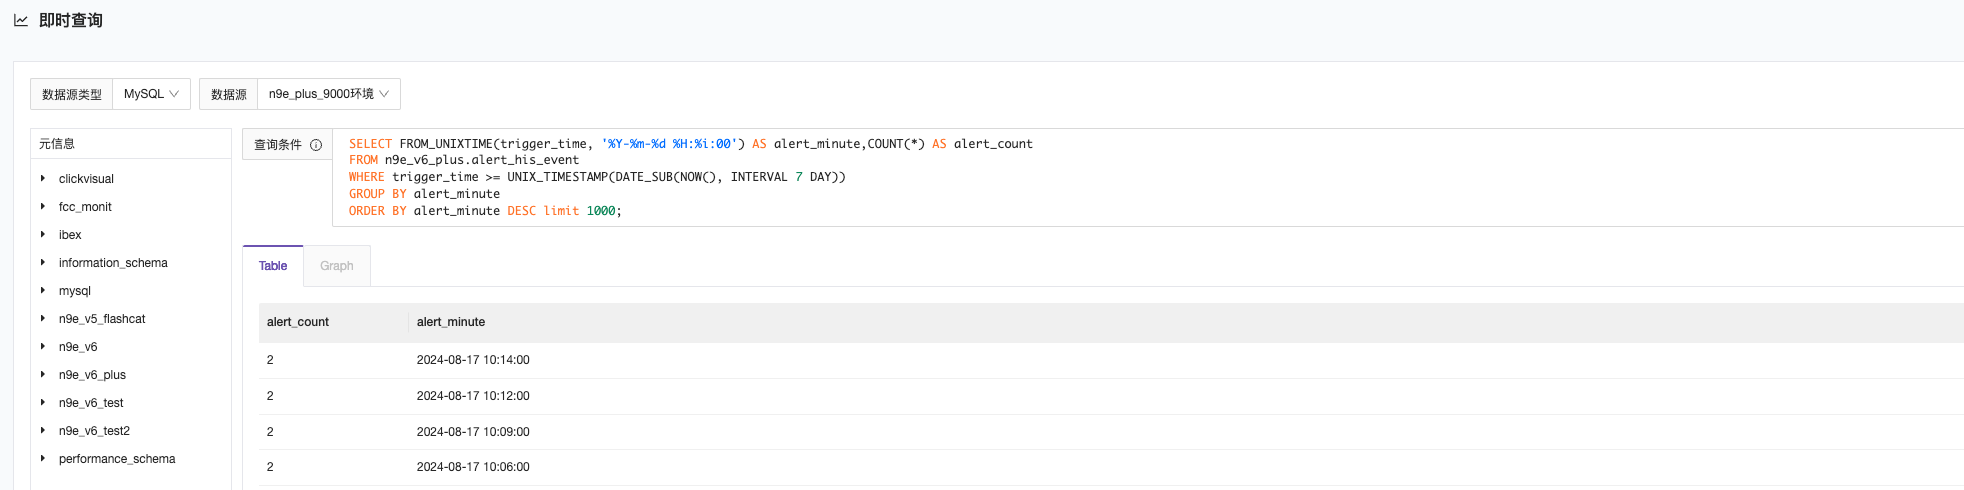
2.3 Query the number of alerts generated per minute in the last 7 days
SELECT FROM_UNIXTIME(trigger_time, '%Y-%m-%d %H:%i:00') AS alert_minute,COUNT(*) AS alert_count
FROM n9e_v6_plus.alert_his_event
WHERE trigger_time >= UNIX_TIMESTAMP(DATE_SUB(NOW(), INTERVAL 7 DAY))
GROUP BY alert_minute
ORDER BY alert_minute DESC LIMIT 100;
2.4 Query the number of alerts generated per minute in the last 7 days
SELECT FROM_UNIXTIME(trigger_time, '%Y-%m-%d %H:%i:00') AS alert_minute,COUNT(*) AS alert_count
FROM n9e_v6_plus.alert_his_event
WHERE trigger_time >= UNIX_TIMESTAMP(DATE_SUB(NOW(), INTERVAL 7 DAY))
GROUP BY alert_minute
ORDER BY alert_minute DESC;
2.5 Example table structure for alert_his_event
CREATE TABLE `alert_his_event` (
    `id` bigint unsigned not null AUTO_INCREMENT,
    `cate` varchar(128) not null,
    `rule_id` bigint unsigned not null,
    `rule_name` varchar(255) not null,
    `prom_ql` varchar(8192) not null comment 'promql',
    `first_trigger_time` bigint,
    `trigger_time` bigint not null,
    `trigger_value` varchar(255) not null,
    PRIMARY KEY (`id`),
    KEY (`trigger_time`, `rule_id`)
) ENGINE=InnoDB DEFAULT CHARSET = utf8mb4;
Using Macros
When configuring dashboards, it is common to require dynamic time ranges that change according to the time range selected in the dashboard’s top-right corner. In such cases, you can use time-related macros. Below are the currently supported macros and their descriptions (Note: in the following explanations, 1494410783 is the start time passed by the front end, and 1494410983 is the end time passed by the front end):
| Macro | Description |
|---|---|
$__timeFilter(dateColumn) |
If dateColumn is in the format %Y-%m-%d %H:%i:%s, this macro can be used, and it will be replaced by dateColumn BETWEEN FROM_UNIXTIME(1494410783) AND FROM_UNIXTIME(1494410983) |
$__timeFrom() |
If the time column format is %Y-%m-%d %H:%i:%s, this macro can be used and will be replaced with the selected start time. FROM_UNIXTIME(1494410783) |
$__timeTo() |
If the time column format is %Y-%m-%d %H:%i:%s, this macro can be used and will be replaced with the selected end time. FROM_UNIXTIME(1494410983) |
$__unixEpochFilter(dateColumn) |
If dateColumn is in Unix timestamp format, it will be replaced by dateColumn > 1494410783 AND dateColumn < 1494497183 |
$__unixEpochFrom() |
Replaced by the currently selected start time in Unix timestamp format. For example, 1494410783 |
$__unixEpochTo() |
Replaced by the currently selected end time in Unix timestamp format. For example, 1494497183 |
$__unixEpochNanoFilter(dateColumn) |
If dateColumn is in nanosecond timestamp format, it will be replaced by dateColumn > 1494410783152415214 AND dateColumn < 1494410983142514872 |
$__unixEpochNanoFrom() |
Replaced by the currently selected start time in nanosecond timestamp format. For example, 1494410783152415214 |
$__unixEpochNanoTo() |
Replaced by the currently selected end time in nanosecond timestamp format. For example, 1494410983142514872 |
$__timeGroup(dateColumn,'5m') |
Used in group by to aggregate data by 5-minute intervals |
$__unixEpochGroup(dateColumn,'5m') |
Used in group by to aggregate data by 5-minute intervals |
Example of Using Macros
Using the alert_his_event table as an example, the SQL query to count the number of alerts per minute within a specific time range is as follows:
SELECT
  $__unixEpochGroup(trigger_time, '1m') AS time,
  COUNT(*) AS alert_count
FROM
  n9e_v6_plus.alert_his_event
WHERE
  $__unixEpochFilter(trigger_time)
GROUP BY
  time
ORDER BY
  time


