Deploying Prometheus Time-Series Database
# Install script
version=2.45.3
filename=prometheus-${version}.linux-amd64
mkdir -p /opt/prometheus
wget https://github.com/prometheus/prometheus/releases/download/v${version}/${filename}.tar.gz
tar xf ${filename}.tar.gz
cp -far ${filename}/*  /opt/prometheus/

# Download installation package
mkdir -p /opt/prometheus
cd /opt/prometheus
wget download.flashcat.cloud/prometheus-2.50.1.linux-amd64.tar.gz

# Create prometheus.service file
cat <<EOF >/etc/systemd/system/prometheus.service
[Unit]
Description="prometheus"
Documentation=https://prometheus.io/
After=network.target

[Service]
Type=simple

ExecStart=/opt/prometheus/prometheus --config.file=/opt/prometheus/prometheus.yml --storage.tsdb.path=/opt/prometheus/data --web.enable-lifecycle --web.enable-remote-write-receiver

Restart=on-failure
SuccessExitStatus=0
LimitNOFILE=65536
StandardOutput=syslog
StandardError=syslog
SyslogIdentifier=prometheus


[Install]
WantedBy=multi-user.target
EOF

# Start the service
systemctl enable prometheus
systemctl restart prometheus
systemctl status prometheus
Note: To enable Prometheus to receive data using the remote write protocol, you need to add --enable-feature=remote-write-receiver in the startup parameters. Without this, Prometheus will not listen on the /api/v1/write endpoint, and Nightingale’s data forwarding will return a 404 error.
Prometheus Data Source Configuration
Configuration Parameters Description
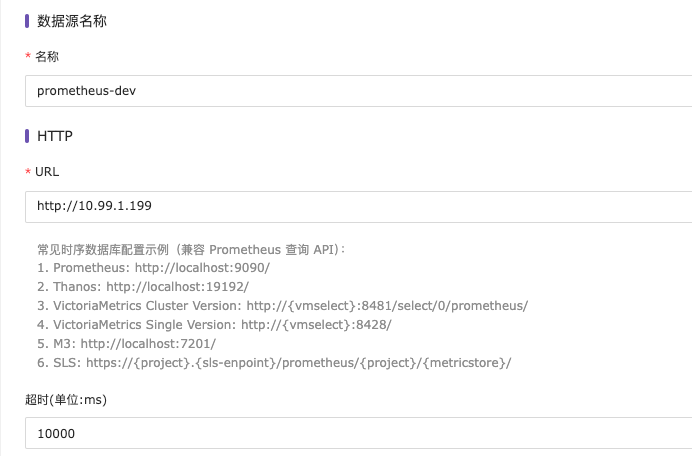
Name: The display name of the Prometheus database
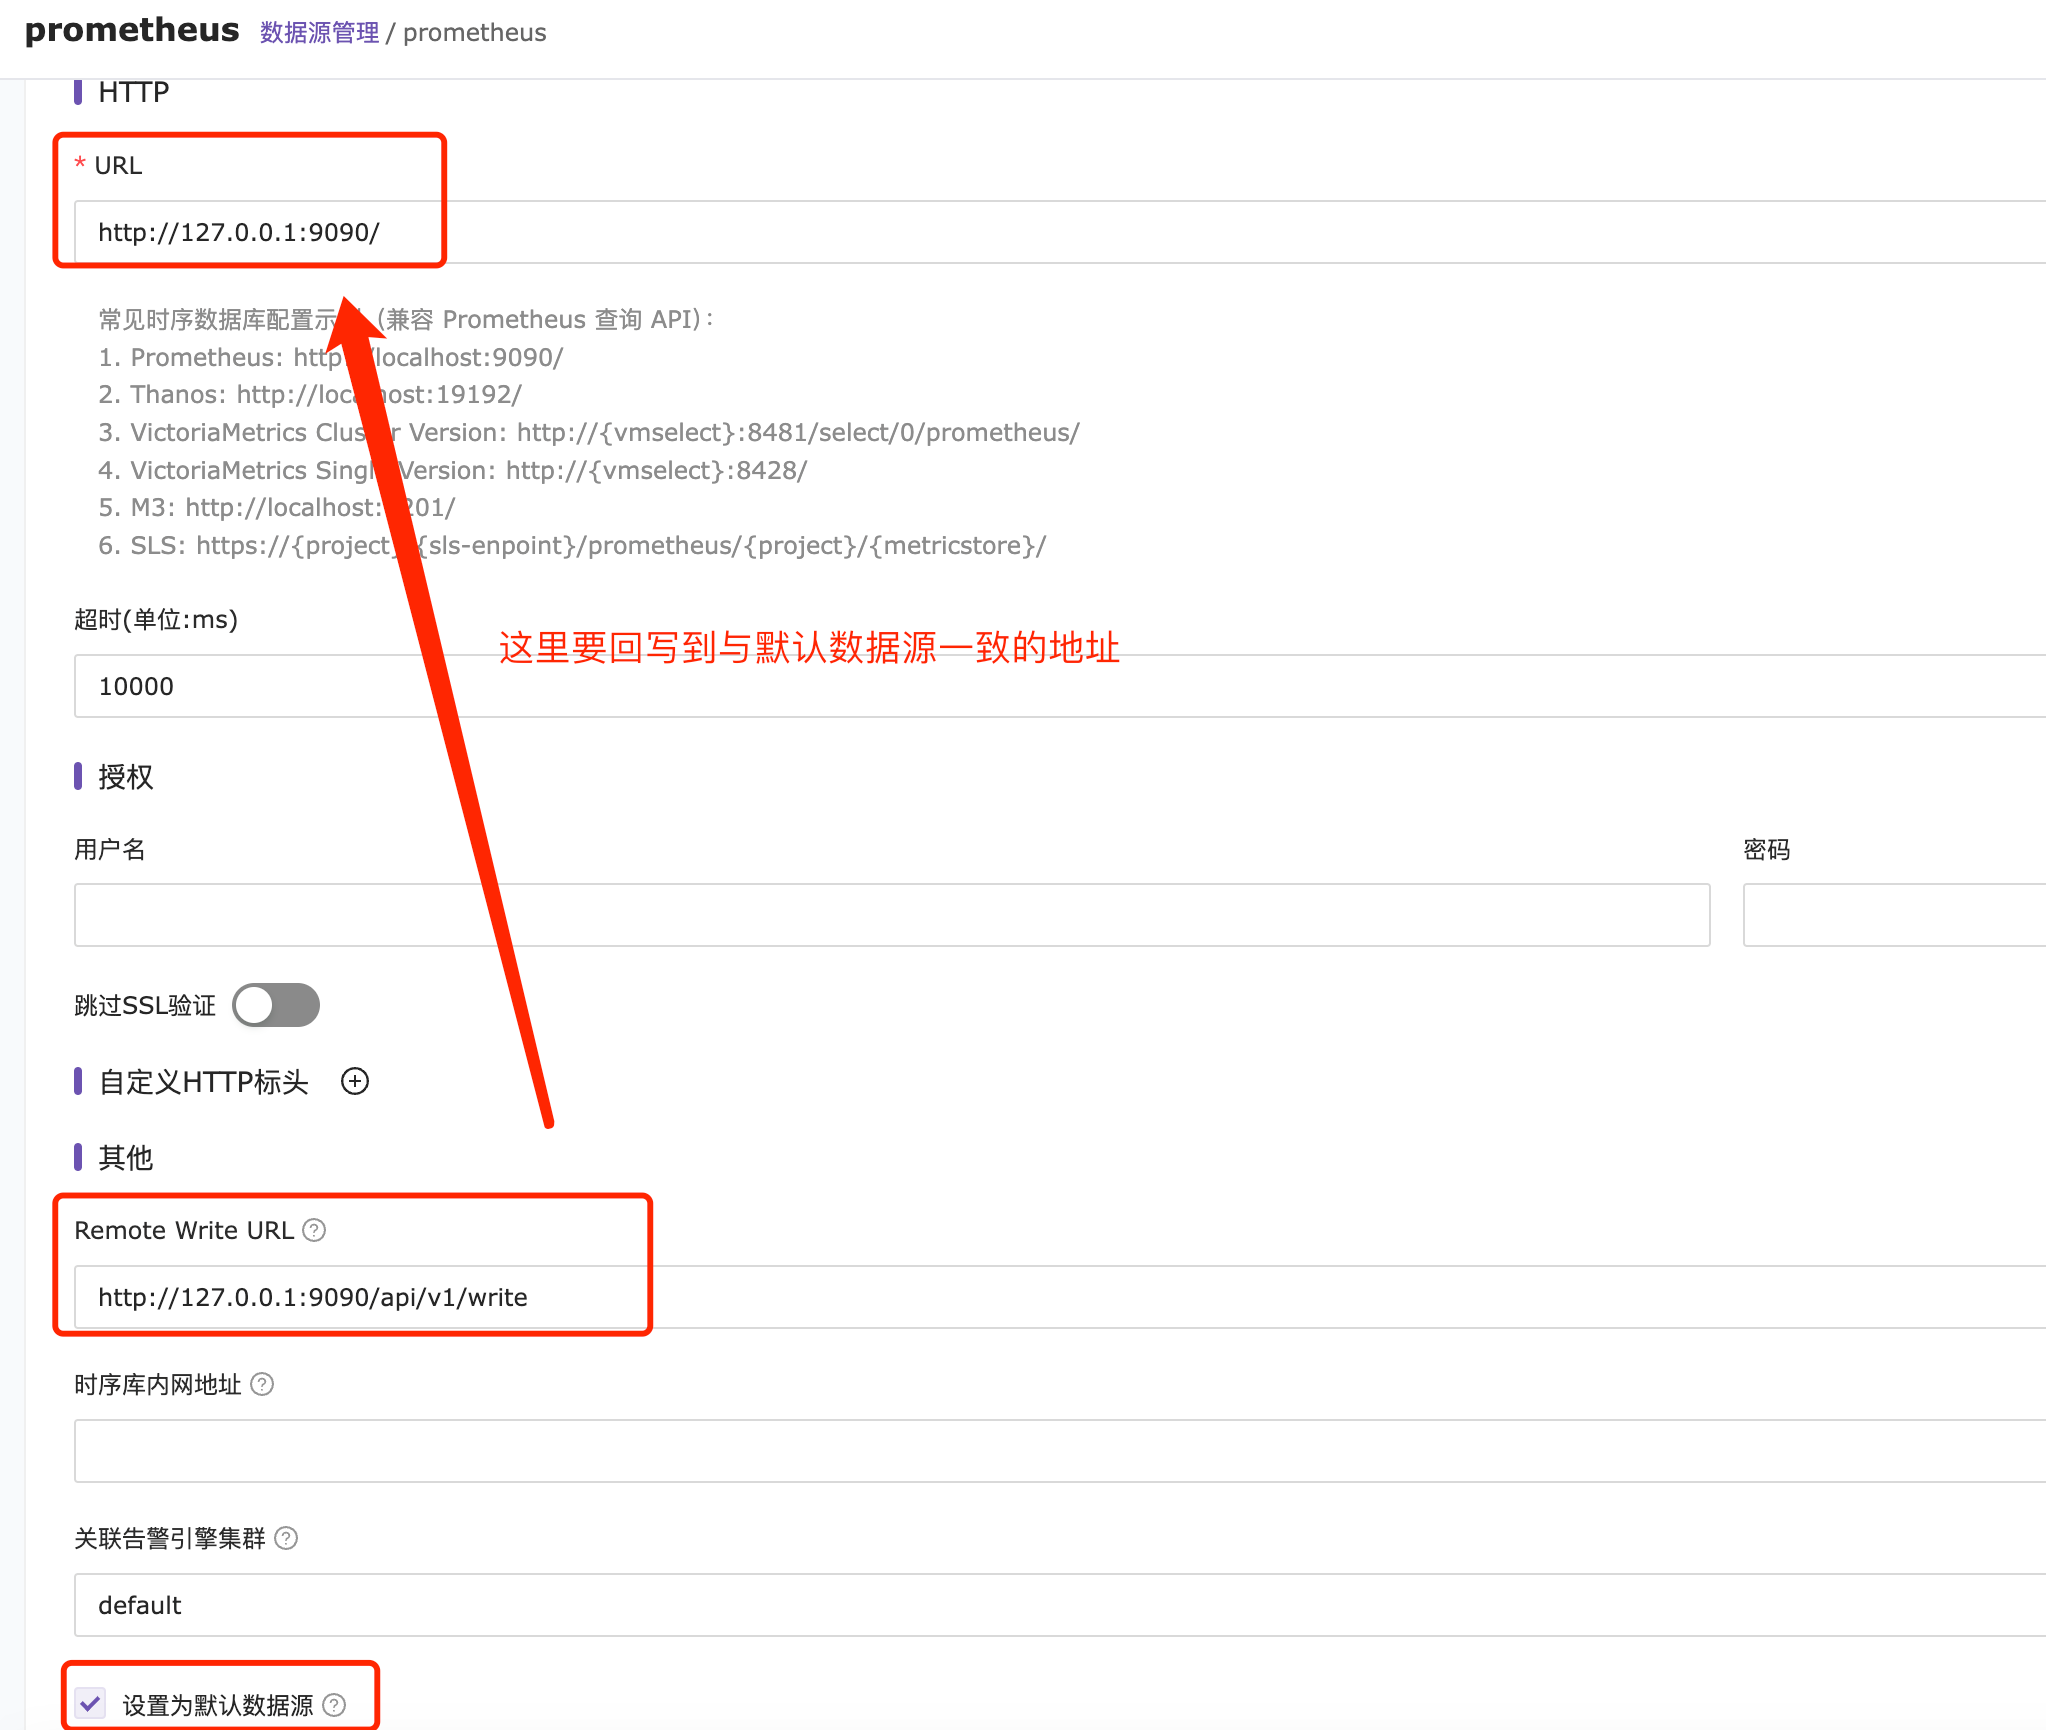
URL: The address of the Prometheus database, e.g., http://${server-ip}:9090/
Timeout (ms): Set the timeout for connecting to the Prometheus database
Username & Password: If Prometheus access authentication is enabled, you need to enter the username and password here. The password should be the original one, not the hashed one.

If Prometheus uses username and password authentication, this configuration needs to be enabled. By default, the username and password are specified in the basic_auth_users section of the web-config.yml file. For security, the password is encrypted using the bcrypt hashing algorithm, so the Prometheus administrator must configure it in advance.

Header & Value: Configure the verification parameters for requesting the Prometheus interface;

Remote Write: Use probing features: If using recording rules or probing features, the metrics collected by probing need to be written back to the default data source database address using Remote Write.
Remote Read: Configure the edge module’s internal network time-series database; this is usually used in scenarios where the alert engine is deployed in an edge data center. If this field is not empty, n9e-edge will use this address to access the time-series database. If this field is empty, n9e-edge will use the URL above to access the time-series database; Edge Data Center Reference
Associate Alarm Engine Cluster: Configure the binding of the data source to a specified alarm engine;
Set as Default Data Source: Set whether this is the default database for network detection and pingmesh data storage. If there are multiple time-series databases, only one can be set as the network detection data storage database;
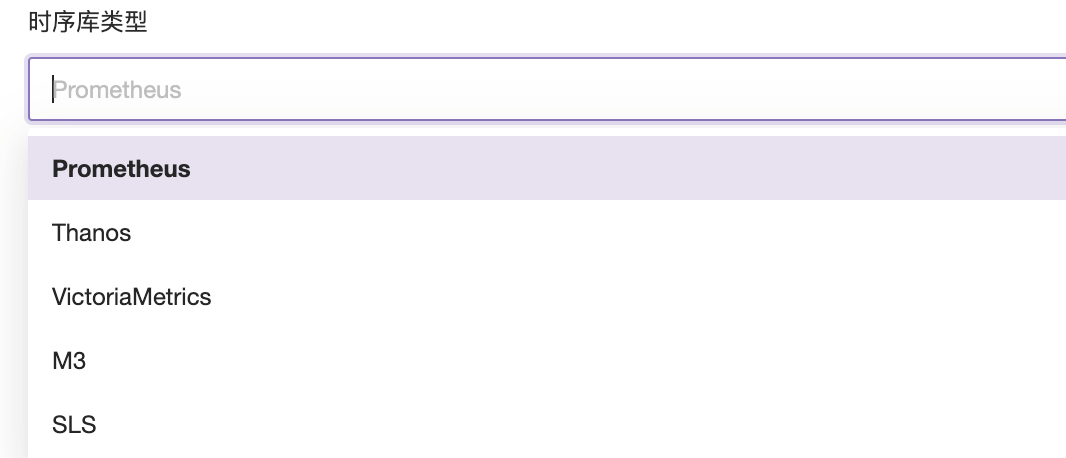
Time-Series Database Type: Select according to the type of data source being accessed; this configuration parameter primarily optimizes dashboard data queries;
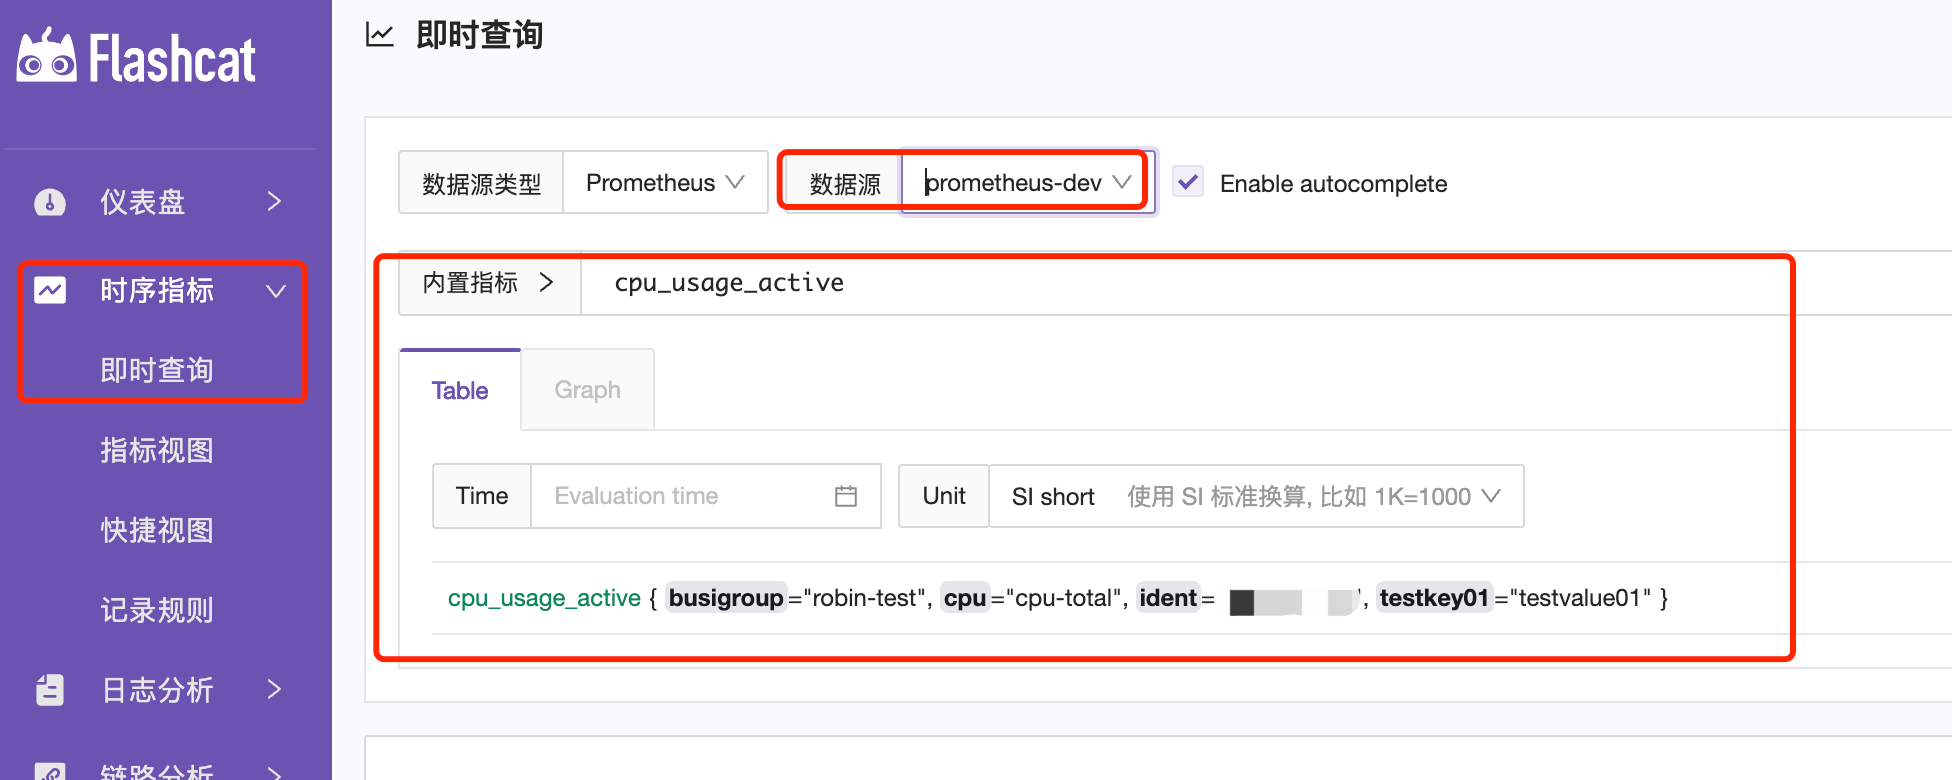
Query Data
Once configured, you can see the newly created Prometheus data source under the integrated data sources.

In the time-series metrics—instant query—select Prometheus as the data source, and enter the metrics in the built-in metrics box to query time-series data normally. (Before querying, make sure that data has been written to this time-series database.)