写在前面
HAProxy 监控的核心链路很直接:先让 HAProxy 暴露 stats 或 Prometheus 格式指标,再由监控采集器抓取并上报。不同 HAProxy 版本的入口略有不同,本文同时覆盖内置 Prometheus exporter 和老版本 stats CSV 两种思路。
核心要点
- HAProxy 2.0.0 之后可以通过编译参数启用内置 Prometheus exporter。
- HAProxy 老版本可以开启 stats 页面,并通过
;csv后缀获取更适合程序解析的 CSV 输出。 - Categraf 的 HAProxy 插件通过
conf/input.haproxy/haproxy.toml配置采集地址。 - 使用
./categraf --test --inputs haproxy可以先验证采集结果,再正式上报。 - 仪表盘可以从 Categraf 仓库对应插件目录获取并导入夜莺。
由于 Prometheus 越来越流行,HAProxy 从 2.0.0 版本开始,直接内置提供了 Prometheus exporter 的能力,只需要在编译 HAProxy 二进制的时候开启相关的参数即可。
如果是 2.0.x - 2.3.x 的 HAProxy,可以这么 make:
make TARGET=linux-glibc EXTRA_OBJS="contrib/prometheus-exporter/service-prometheus.o"
如果是 2.4.x 的 HAProxy,可以这么 make:
make TARGET=linux-glibc USE_PROMEX=1
最后在 haproxy.cfg 中开启相关的 frontend 即可,示例如下:
frontend stats
    bind *:8404
    http-request use-service prometheus-exporter if { path /metrics }
    stats enable
    stats uri /stats
    stats refresh 10s
那如果是老版本的 HAProxy,应该如何暴露监控数据呢?下面我们一起来看一下。
| HAProxy 版本 | 暴露方式 | 关键配置 |
|---|---|---|
| 2.0.x - 2.3.x | 编译 Prometheus exporter object | EXTRA_OBJS="contrib/prometheus-exporter/service-prometheus.o" |
| 2.4.x | 编译启用 Prometheus exporter | USE_PROMEX=1 |
| 老版本 | stats CSV 接口 | stats uri /stats,采集时访问 /stats;csv |
开启 stats
首先也是开启 stats 暴露监控数据,老版本没有 prometheus-exporter 这个 service 可用,那就不加这行配置:
frontend stats
    bind *:8404
    stats enable
    stats uri /stats
    stats refresh 10s
开启 stats 之后可以做个测试,请求一下 8404,下面是我的测试结果:
[root@fc-demo-04 ~]# curl -s "http://localhost:8404/stats;csv"
# pxname,svname,qcur,qmax,scur,smax,slim,stot,bin,bout,dreq,dresp,ereq,econ,eresp,wretr,wredis,status,weight,act,bck,chkfail,chkdown,lastchg,downtime,qlimit,pid,iid,sid,throttle,lbtot,tracked,type,rate,rate_lim,rate_max,check_status,check_code,check_duration,hrsp_1xx,hrsp_2xx,hrsp_3xx,hrsp_4xx,hrsp_5xx,hrsp_other,hanafail,req_rate,req_rate_max,req_tot,cli_abrt,srv_abrt,comp_in,comp_out,comp_byp,comp_rsp,lastsess,last_chk,last_agt,qtime,ctime,rtime,ttime,
stats,FRONTEND,,,2,2,3000,91818,9548841,122205596,0,0,0,,,,,OPEN,,,,,,,,,1,2,0,,,,0,1,0,1,,,,0,91817,0,0,0,0,,1,1,91818,,,0,0,0,0,,,,,,,,
main,FRONTEND,,,0,40,3000,2146,473473,42483334,0,0,552,,,,,OPEN,,,,,,,,,1,3,0,,,,0,0,0,25,,,,0,1588,0,800,2,4,,0,25,2394,,,0,0,0,0,,,,,,,,
app,app1,0,0,0,4,2000,921,219583,18341824,,0,,0,0,0,0,UP,1,1,0,35,6,499891,44,,1,4,1,,921,,2,0,,13,L4OK,,1,0,794,0,126,0,0,0,,,,5,0,,,,,2631,,,0,0,0,273,
app,app2,0,0,0,5,2000,921,208287,24044032,,0,,0,0,0,0,UP,1,1,0,40,7,441281,54,,1,4,2,,921,,2,0,,12,L4OK,,0,0,794,0,125,1,0,0,,,,6,0,,,,,2370,,,0,0,0,276,
app,BACKEND,0,0,0,9,300,1845,428366,42385856,0,0,,0,0,0,0,UP,2,2,0,,0,1385408,0,,1,4,0,,1842,,1,0,,25,,,,0,1588,0,251,2,4,,,,,14,0,0,0,0,0,2370,,,0,0,0,300,
注意一定要有 ;csv 这个后缀,否则返回的是 html 格式,程序来解析就费劲的多了。监控 agent 来采集 HAProxy 的监控数据,其实就是采集这个接口的输出内容。下面我们用 Categraf 给大家做个演示。
配置 Categraf 的 HAProxy 采集插件
Categraf 的 HAProxy 采集插件配置文件在 conf/input.haproxy/haproxy.toml,样例配置如下:
[[instances]]
# URI on which to scrape HAProxy.
# e.g.
# uri = "http://localhost:5000/baz?stats;csv"
# uri = "http://user:pass@haproxy.example.com/haproxy?stats;csv"
# uri = "unix:/run/haproxy/admin.sock"
uri = ""

# Flag that enables SSL certificate verification for the scrape URI
ssl_verify = false

# Comma-separated list of exported server metrics. See http://cbonte.github.io/haproxy-dconv/configuration-1.5.html#9.1
server_metric_fields = ""

# Comma-separated list of exported server states to exclude. See https://cbonte.github.io/haproxy-dconv/1.8/management.html#9.1, field 17 status
server_exclude_states = ""

# Timeout for trying to get stats from HAProxy.
timeout = "5s"

# Flag that enables using HTTP proxy settings from environment variables ($http_proxy, $https_proxy, $no_proxy)
proxy_from_env = false
uri 是 stats 接口的访问地址,我本地的话就配置成 http://localhost:8404/stats;csv 就可以了,其他配置都比较简单,见名知意,比如 ssl_verify 控制是否开启 ssl 验证。
| 配置项 | 作用 |
|---|---|
uri |
HAProxy stats CSV 接口地址,也可以是 Unix socket |
ssl_verify |
控制是否校验 SSL 证书 |
server_metric_fields |
指定导出的 server 指标字段 |
server_exclude_states |
排除指定 server 状态 |
timeout |
获取 HAProxy stats 的超时时间 |
proxy_from_env |
是否使用环境变量中的 HTTP 代理配置 |
验证采集数据
我们通过 Categraf 的 --test 模式做个测试,通过 --inputs haproxy 指定 Categraf 只启用 HAProxy 这个插件,开整:
[root@fc-demo-04 qinxiaohui]# ./categraf --test --inputs haproxy
...
13:53:30 haproxy_frontend_request_errors_total agent_hostname=fc-demo-04 frontend=stats 0
13:53:30 haproxy_frontend_http_responses_total agent_hostname=fc-demo-04 code=3xx frontend=stats 0
13:53:30 haproxy_frontend_http_requests_total agent_hostname=fc-demo-04 frontend=stats 91854
13:53:30 haproxy_frontend_max_sessions agent_hostname=fc-demo-04 frontend=stats 2
13:53:30 haproxy_frontend_requests_denied_total agent_hostname=fc-demo-04 frontend=stats 0
13:53:30 haproxy_frontend_http_responses_total agent_hostname=fc-demo-04 code=5xx frontend=stats 0
13:53:30 haproxy_frontend_compressor_bytes_out_total agent_hostname=fc-demo-04 frontend=stats 0
13:53:30 haproxy_frontend_current_sessions agent_hostname=fc-demo-04 frontend=stats 2
...
上面我只是截取了一部分输出,明显可以看到监控数据都可以采集上来了。配置一下 Categraf 的 config.toml 把数据写给远端就可以了。
验证时建议重点看三类输出:
- frontend 指标:例如请求量、响应状态码、当前连接数、最大会话数。
- backend/server 指标:例如后端状态、连接、重试、错误等。
- 标签信息:例如
agent_hostname、frontend、code等标签是否符合后续查询和告警需求。
仪表盘
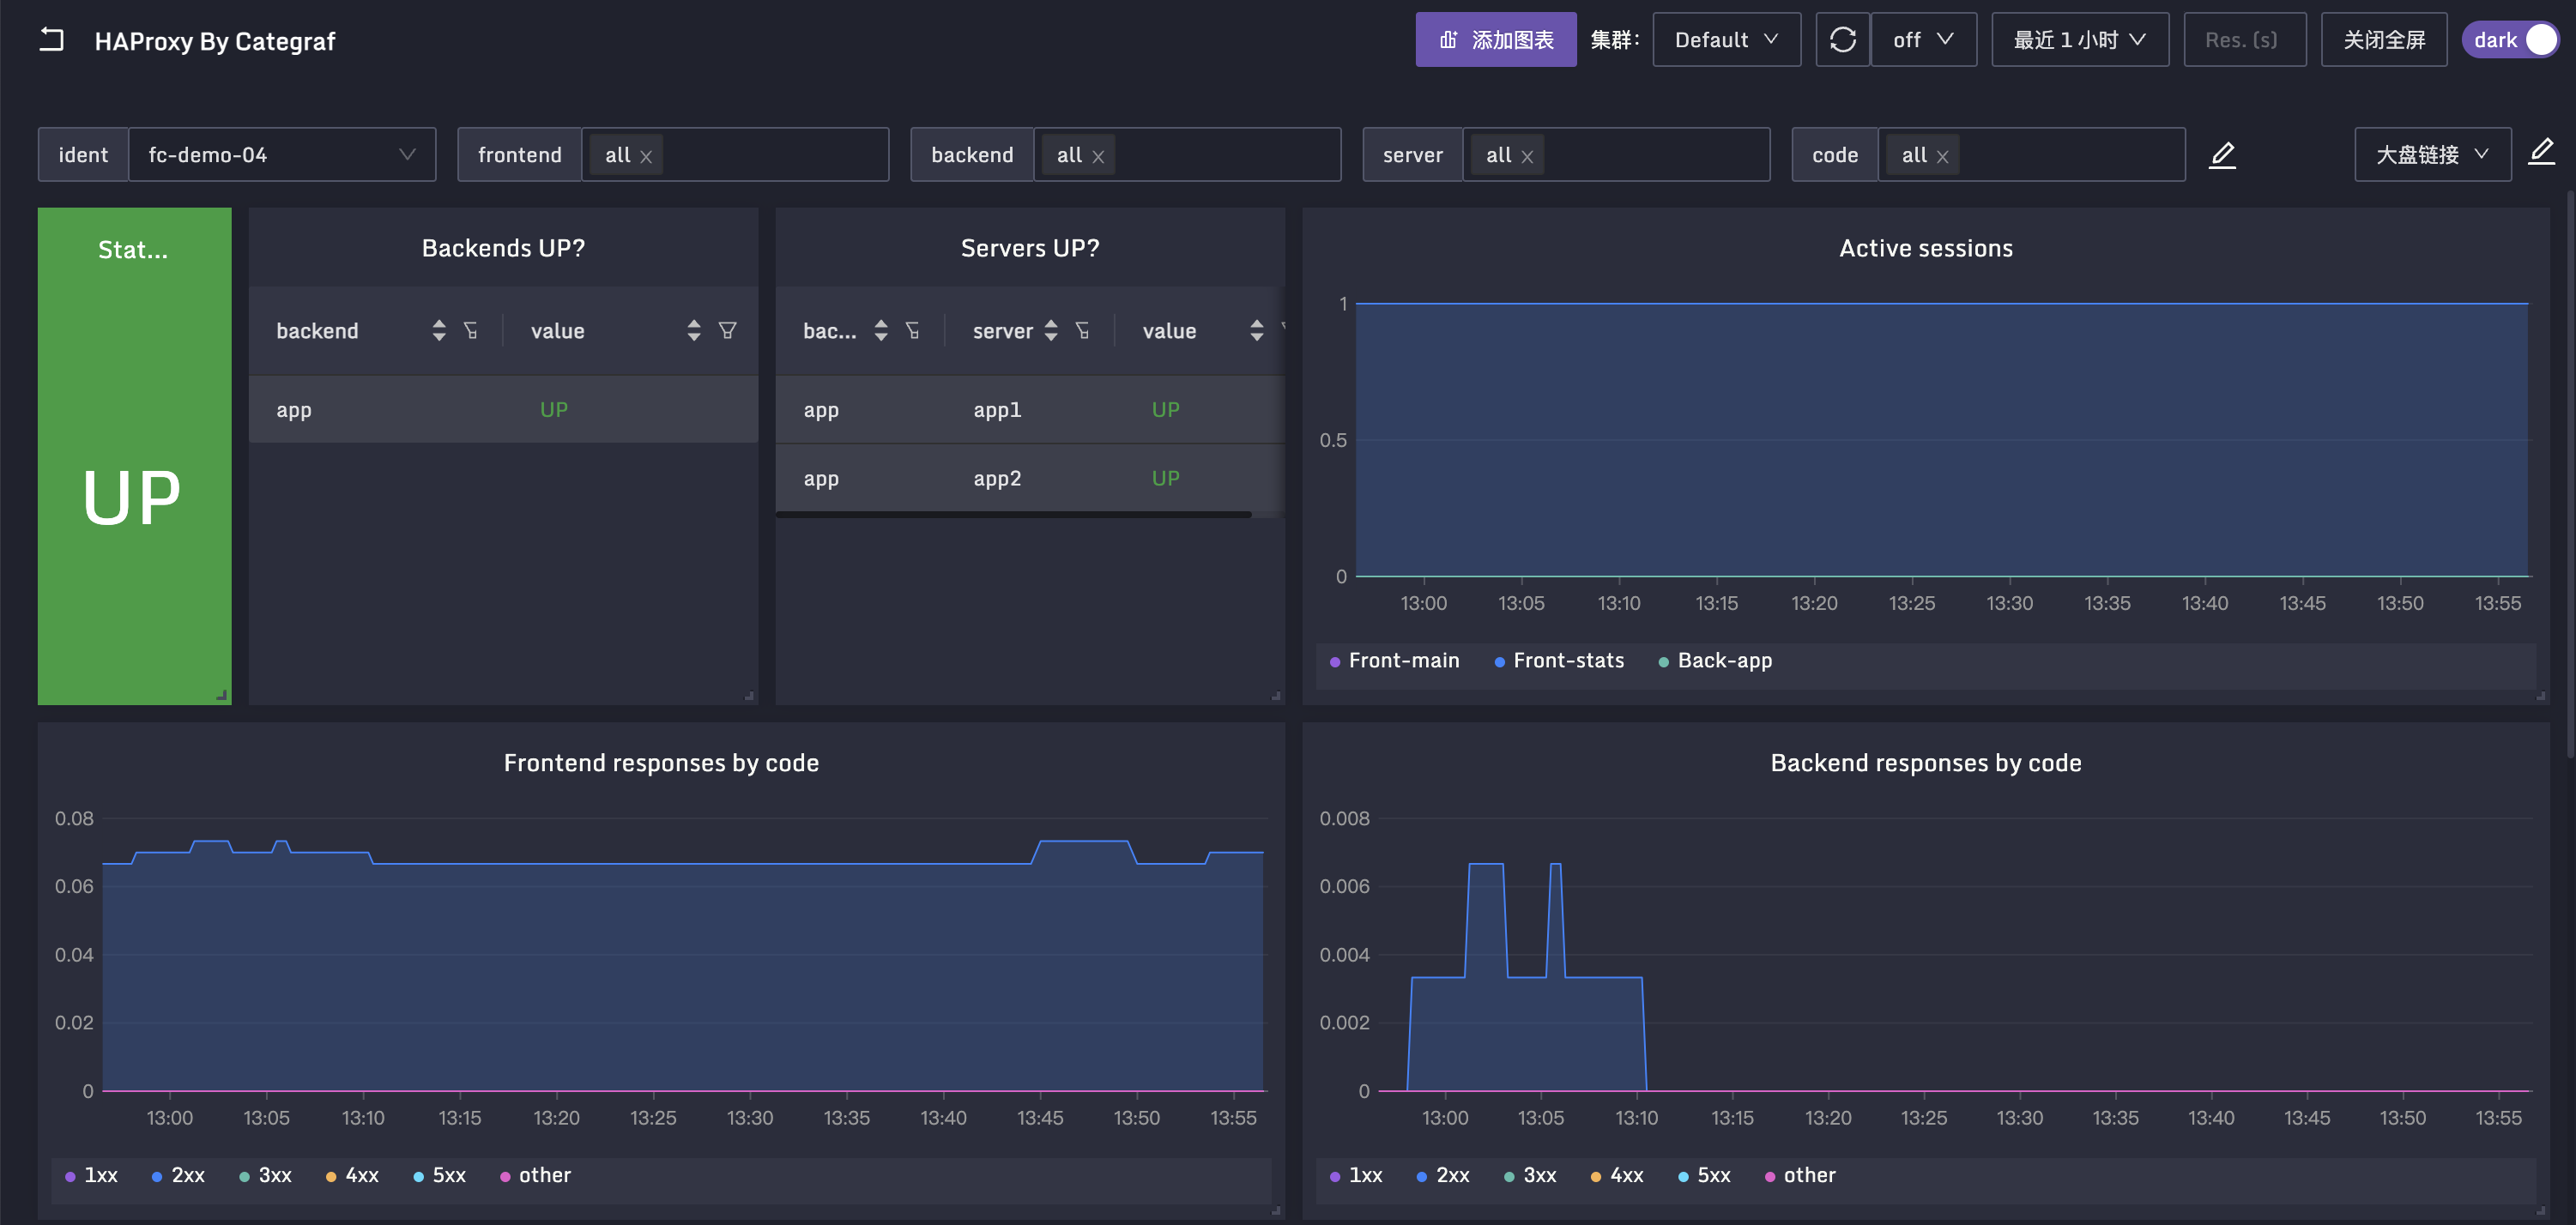
这里我也为大家整理了仪表盘,放到了 Categraf 的代码仓库中了,知道怎么找吧?Categraf 的各个采集插件对应的仪表盘都在采集插件的代码目录下,比如 HAProxy 的仪表盘,就在 https://github.com/flashcatcloud/categraf/tree/main/inputs/haproxy 目录下,名称是 dashboard.json,导入夜莺即可使用,样例如下:
FAQ
为什么访问 stats 时一定要加 ;csv?
不加 ;csv 通常返回 HTML 页面,适合人看;加上 ;csv 返回 CSV 内容,更适合监控采集器解析。
新版本 HAProxy 还需要通过 stats CSV 采集吗?
如果已经启用了内置 Prometheus exporter,可以直接采集 Prometheus 格式指标。stats CSV 方式更适合老版本或已有 stats 配置的场景。
如何确认 Categraf 配置正确?
先把 uri 配成可访问的 stats CSV 地址,再执行 ./categraf --test --inputs haproxy。能看到 haproxy_frontend_* 等指标输出,就说明采集链路基本正常。
总结
HAProxy 监控可以按版本选择入口:新版本优先考虑内置 Prometheus exporter,老版本使用 stats CSV 接口。无论哪种方式,核心都是让 HAProxy 暴露可机器解析的指标,再由 Categraf、Prometheus 等采集器抓取,最终进入时序库和仪表盘。本文示例展示了从暴露 stats、配置 Categraf、验证指标到导入仪表盘的完整路径。
关于作者
本文作者秦晓辉,Flashcat合伙人,文章内容是快猫技术团队共同沉淀的结晶,作者做了编辑整理,我们会持续输出监控、稳定性保障相关的技术文章,文章可转载,转载请注明出处,尊重技术人员的成果。