
Apache 是老一辈 Web Server,LAMP 中的 A 就是 Apache,占据了很高的市场份额。Apache 的进程是 httpd,其服务稳定性至关重要,本文讲解如何使用 Categraf 监控 Apache 的性能指标,及时发现可能的故障,保障 Apache Web Server 的稳定性。
核心要点摘要
- 本文以 CentOS 8.2 和 Categraf v0.3.79 为测试环境,演示 Apache httpd 监控采集流程。
- 采集前需要先安装并启动 httpd,再开启
/server-status页面。 - Categraf 使用
conf/input.apache/apache.toml中的scrape_uri读取 Apache stub status 自动输出。 - 配置完成后,先用
./categraf --test --inputs apache验证采集,再重启 Categraf 服务。 - 如果采集不到数据,优先检查 httpd 服务状态、
server-status配置、访问路径和 Categraf 配置文件。
Apache 监控测试环境
- 操作系统 版本: Centos 8.2
- Categraf 版本: v0.3.79
| 环节 | 目标 | 关键命令或文件 |
|---|---|---|
| 安装 Apache | 准备 httpd 服务 | sudo yum install -y httpd |
| 开启状态页 | 暴露 Apache 运行状态 | /etc/httpd/conf/httpd.conf 或 /etc/apache2/apache2.conf |
| 启动服务 | 让 httpd 正常运行 | systemctl enable/start/status httpd |
| 配置 Categraf | 指定采集地址 | conf/input.apache/apache.toml |
| 测试采集 | 验证插件能拉到指标 | ./categraf --test --inputs apache |
安装 Apache
在基于 RHEL 的发行版中,Apache 软件包和服务被称为 httpd。想要安装 Apache,使用 root 或者其他有 sudo 权限的用户身份,运行下面的命令:
sudo yum install -y httpd
安装 httpd 可能遇到的问题
如若 yum 安装报如下错:
- 段错误
- cache错误
- Repository AppStream is listed more than once in the configuration
- Repository extras is listed more than once in the configuration
- Repository PowerTools is listed more than once in the configuration
- Repository centosplus is listed more than once in the configuration
请参考 此博客 进行排查修复。
配置 Apache stub status
编辑 Apache 的配置文件(通常位于 /etc/httpd/conf/httpd.conf 或 /etc/apache2/apache2.conf)并确保包含以下内容:
<Location "/server-status">
    SetHandler server-status
</Location>
<Location "/server-status">:Location 指令用于匹配客户端请求的 URL 路径。在这个例子中,/server-status是客户端请求的路径SetHandler server-status:SetHandler 指令告诉 Apache 对该路径使用server-status处理程序。server-status是 Apache 提供的一个内置处理程序,负责输出服务器的状态信息。这些信息包括当前的请求处理情况、工作线程状态、系统性能等。
启动 Apache
# 设置 httpd 服务开机自启
sudo systemctl enable httpd
# 启动 httpd 服务
sudo systemctl start httpd
# 查看 httpd 服务状态
sudo systemctl status httpd
关于 Apache stub status 的详细信息,请查阅:Apache stub staus。
Categraf Apache 监控插件
Categraf Apache 监控插件的配置文件路径是:conf/input.apache/apache.toml,配置样例如下:
[[instances]]
scrape_uri = "http://localhost/server-status/?auto"
host_override = ""
insecure = false
custom_headers = {}
log_level = "info"
完成配置之后,可以通过 Categraf test 命令来测试是否能够采集到 Apache 的性能指标:
./categraf --test --inputs apache
如果一切正常,可以看到类似如下的输出:
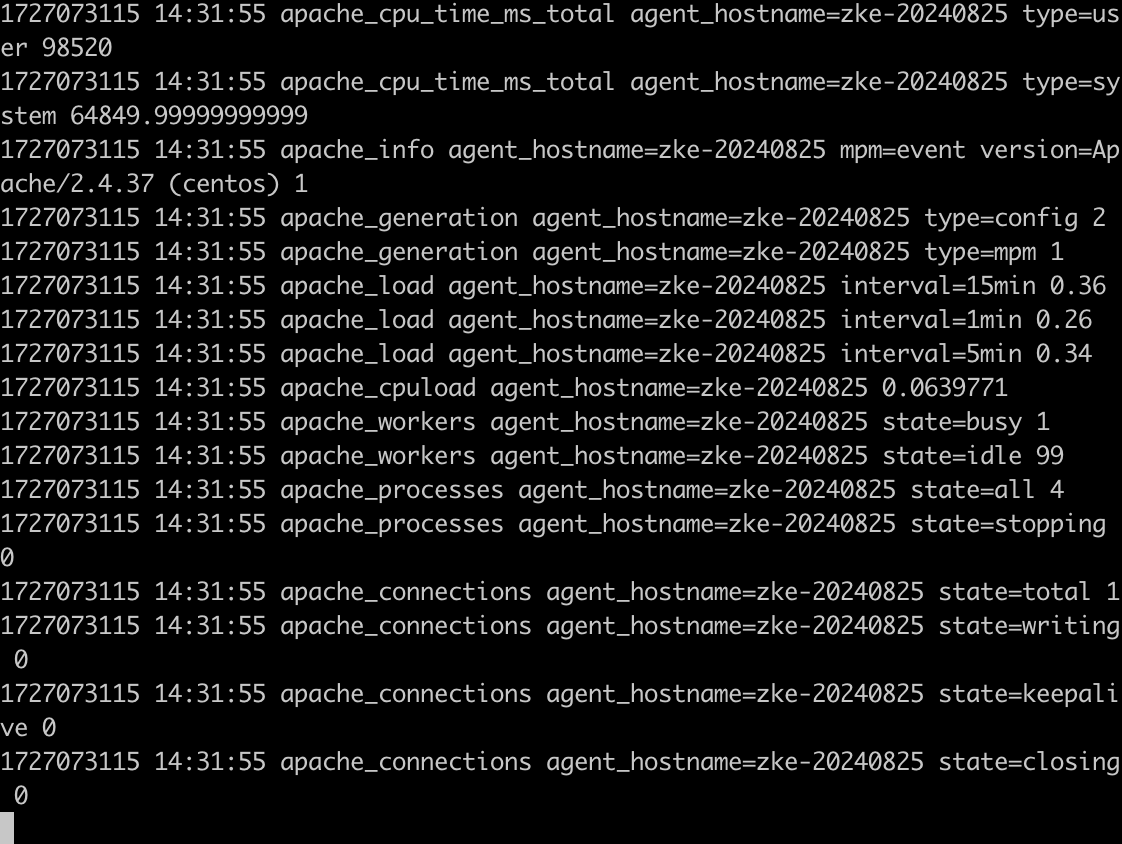
监控指标中包含了CPU 占用、Worker 数量、连接数等信息。之后通过 systemctl restart categraf 重启 Categraf 服务,即可开始监控 Apache 的性能指标,稍等片刻,理论上就可以在时序库中查到 Apache 的性能指标。
采集失败时优先排查什么
如果 ./categraf --test --inputs apache 没有返回预期指标,可以按下面顺序排查:
- 确认 httpd 正在运行:
systemctl status httpd。 - 确认 Apache 配置里已经开启
SetHandler server-status。 - 在本机访问
http://localhost/server-status/?auto,确认能看到文本格式状态输出。 - 确认 Categraf 的
scrape_uri与实际访问地址一致。 - 如果 Apache 配置了访问控制、HTTPS 或自定义 Header,同步调整
apache.toml中的insecure、custom_headers等参数。
常见问题
为什么要使用 /server-status/?auto?
/server-status 是 Apache 的状态页面,追加 ?auto 后更适合程序采集。Categraf 插件可以从这个地址读取 Apache 的运行状态,并转换为监控指标。
只配置 Categraf 就够了吗?
不够。Categraf 只是采集器,前提是 Apache 已经开启状态页,并且 Categraf 所在机器能访问 scrape_uri。如果状态页没有开启,插件无法凭空获取 Apache 的内部状态。
采集到指标后还需要做什么?
采集只是第一步。后续还需要在时序库、告警系统或仪表盘中使用这些指标,例如关注 Worker、连接数、请求处理状态和 CPU 占用,避免 Apache Web Server 的性能问题长期不可见。
如此便完成了 Apache Web Server 的监控数据采集,希望对您有帮助。
关于作者
本文作者王玉松,文章可转载,转载请注明出处,尊重技术人员的成果。