
MongoDB 监控比 MySQL、Redis 更容易被低估。单节点只需要看实例是否存活、连接数、内存和操作延迟;副本集还要看成员状态、Primary 切换和复制延迟;分片集群又多了 mongos、config server、shard replica set 的采集边界。
Categraf 的 mongodb 插件封装了 Percona mongodb_exporter 的能力,可以采集 serverStatus、dbStats、collStats、indexStats、top、replSetGetStatus 等指标,并写入夜莺、Prometheus、VictoriaMetrics 等后端。
这篇文章基于 Docker 测试环境验证,覆盖三种拓扑的采集配置和排障要点。
核心要点
- MongoDB 插件配置在
conf/input.mongodb/mongodb.toml,实例地址使用mongodb_uri。 - Dashboard 需要稳定的
instance和cluster标签;分片环境建议再补topology、component、replset。 collect_all = true会打开诊断、库表、索引、top、副本集状态等采集器,指标很全,但权限和采集成本也更高。- 认证场景下,基础监控至少需要
clusterMonitor和read local;如果开启库表和索引发现,还需要目标库read或readAnyDatabase。 - 从宿主机直连 Docker 副本集节点时,建议设置
direct_connect = true,避免 MongoDB driver 发现容器内 hostname 后从宿主机无法解析。 mongos不支持top和replSetGetStatus,这不是采集失败,而是 MongoDB 组件边界。
1. MongoDB 插件采什么
Categraf MongoDB 插件主要覆盖这些信息:
| 类别 | 典型指标 | 用途 |
|---|---|---|
| 存活状态 | mongodb_up |
判断连接、认证和基础采集是否成功 |
| 采集耗时 | mongodb_scrape_use_seconds |
判断单次采集是否变慢 |
| 实例运行状态 | mongodb_ss_uptime、mongodb_ss_connections |
运行时间、连接数、可用连接 |
| 操作量 | mongodb_ss_opcounters、mongodb_ss_metrics_document |
查询、插入、更新、删除速率 |
| 操作延迟 | mongodb_ss_opLatencies_latency、mongodb_ss_opLatencies_ops |
计算读写和命令平均延迟 |
| WiredTiger | mongodb_ss_wt_cache_* |
缓存、脏页、读写、淘汰情况 |
| 副本集 | mongodb_mongod_replset_member_replication_lag、mongodb_mongod_replset_member_health |
成员健康、复制延迟、选举时间 |
| 库表统计 | mongodb_dbstats_*、mongodb_collstats_* |
库、集合、索引空间和对象数量 |
| top 指标 | mongodb_top_* |
按集合观察读写耗时和次数 |
不同版本和配置下指标名会有差异。当前仓库里的新版夜莺和 Grafana Dashboard 主要使用 mongodb_ss_*、mongodb_mongod_replset_* 和 mongodb_up。
2. 监控账号权限
基础账号:
db.getSiblingDB("admin").createUser({
  user: "categraf",
  pwd: "<MONITOR_PASSWORD>",
  roles: [
    { role: "clusterMonitor", db: "admin" },
    { role: "read", db: "local" }
  ]
});
如果只采集 serverStatus、连接状态、WiredTiger、复制状态等基础指标,这组权限通常够用。
如果开启:
collect_all = true
或者显式开启:
enable_db_stats = true
enable_coll_stats = true
enable_index_stats = true
还需要能读取目标数据库的集合和索引信息。测试环境可以加:
db.getSiblingDB("admin").grantRolesToUser("categraf", [
  { role: "readAnyDatabase", db: "admin" }
]);
生产环境如果不希望给 readAnyDatabase,可以只给需要采集库的 read 权限,并在 Categraf 中限制 coll_stats_namespaces 和 index_stats_collections。
3. 单节点采集配置
最小配置:
[[instances]]
log_level = "error"
labels = { cluster = "mongo-lab", instance = "mongo-single:27017", topology = "single" }
mongodb_uri = "mongodb://127.0.0.1:27017/admin?authSource=admin"
username = "categraf"
password = "<MONITOR_PASSWORD>"
direct_connect = true
collect_all = true
compatible_mode = true
几个配置项说明:
| 配置项 | 作用 |
|---|---|
mongodb_uri |
MongoDB 连接串 |
username / password |
如果不想把账号密码写在 URI 里,可以单独配置 |
direct_connect |
直连单个节点,适合宿主机连接 Docker 映射端口 |
collect_all |
打开所有内置采集器 |
compatible_mode |
额外输出兼容旧版 exporter 的指标名 |
compatible_mode = true 会增加部分兼容指标,适合迁移或复用已有 Dashboard;如果你只使用新版 Dashboard,可以根据实际情况关闭。
4. 副本集采集配置
副本集建议至少采集 Primary 和一个 Secondary。测试环境中从宿主机访问 Docker 映射端口,配置如下:
[[instances]]
log_level = "error"
labels = { cluster = "mongo-lab", instance = "mongo-rs-1:37117", topology = "replica_set", replset = "rs0" }
mongodb_uri = "mongodb://127.0.0.1:37117/admin?authSource=admin"
username = "categraf"
password = "<MONITOR_PASSWORD>"
direct_connect = true
collect_all = true
compatible_mode = true

[[instances]]
log_level = "error"
labels = { cluster = "mongo-lab", instance = "mongo-rs-2:37118", topology = "replica_set", replset = "rs0" }
mongodb_uri = "mongodb://127.0.0.1:37118/admin?authSource=admin"
username = "categraf"
password = "<MONITOR_PASSWORD>"
direct_connect = true
collect_all = true
compatible_mode = true
为什么这里不用一个副本集 URI 一次性写三个节点?
在 Docker 测试环境里,副本集成员地址通常是 mongo-rs-1:27017 这类容器内 hostname。Categraf 从宿主机连接 127.0.0.1:37117 后,driver 发现副本集成员地址,可能会继续访问容器 hostname,宿主机未必能解析。因此测试环境直连每个映射端口更稳定。
生产环境如果 Categraf 所在机器能解析副本集成员地址,可以使用标准副本集 URI。
5. 分片集群采集配置
分片集群至少分三类采集对象:
| 组件 | 是否建议采集 | 说明 |
|---|---|---|
mongos |
建议 | 观察路由层连接、请求、部分 serverStatus 指标 |
| config server | 建议 | 本质是副本集,保存集群元数据 |
| shard server | 强烈建议 | 真正承载数据,需要看副本集状态、复制延迟、存储和 WiredTiger |
mongos 示例:
[[instances]]
log_level = "error"
labels = { cluster = "mongo-lab", instance = "mongos:37517", topology = "sharded", component = "mongos" }
mongodb_uri = "mongodb://127.0.0.1:37517/admin?authSource=admin"
username = "categraf"
password = "<MONITOR_PASSWORD>"
direct_connect = true
collect_all = true
compatible_mode = true
config server 示例:
[[instances]]
log_level = "error"
labels = { cluster = "mongo-lab", instance = "mongo-cfg-1:37217", topology = "sharded", component = "configsvr", replset = "cfgRepl" }
mongodb_uri = "mongodb://127.0.0.1:37217/admin?authSource=admin"
username = "categraf"
password = "<MONITOR_PASSWORD>"
direct_connect = true
collect_all = true
compatible_mode = true
shard server 示例:
[[instances]]
log_level = "error"
labels = { cluster = "mongo-lab", instance = "mongo-shard01-a:37317", topology = "sharded", component = "shardsvr", replset = "shard01" }
mongodb_uri = "mongodb://127.0.0.1:37317/admin?authSource=admin"
username = "categraf"
password = "<MONITOR_PASSWORD>"
direct_connect = true
collect_all = true
compatible_mode = true
注意:如果要直连 shard server,监控账号也要在对应 shard replica set 上存在。只通过 mongos 创建用户,不一定能满足直连 shard 的认证需求。
6. 先验证基础指标
启动 Categraf 前,建议先用测试模式确认采集输出。
./categraf -configs ./categraf-conf -inputs mongodb -test
测试环境中,确认这些指标出现:
mongodb_up
mongodb_scrape_use_seconds
mongodb_ss_uptime
mongodb_ss_connections
mongodb_mongod_replset_member_replication_lag
本次验证中,mongodb_up 覆盖了这些实例:
mongo-single:37017
mongo-rs-1:37117
mongo-rs-2:37118
mongos:37517
mongo-cfg-1:37217
mongo-shard01-a:37317
mongo-shard02-b:37418
所有实例的 mongodb_up 均为 1。
如果 mongodb_up = 0,优先检查:
- Categraf 所在机器能否访问 MongoDB 地址和端口;
mongodb_uri里的authSource是否正确;- 用户名和密码是否正确;
- 监控账号是否存在于直连的 MongoDB 节点或副本集;
- Docker 副本集场景是否需要
direct_connect = true。
7. 写入后端并查询
本次在 10.129.0.69 的 /home/kongfei/categraf 上直接替换配置并运行 MongoDB 采集,remote write 写入:
http://192.168.10.47:17000/prometheus/v1/write
夜莺后端写入 Prometheus,查询端点为:
http://192.168.10.47:9090/api/v1/query
查询:
curl -sS -G http://192.168.10.47:9090/api/v1/query \
  --data-urlencode 'query=mongodb_up{cluster="categraf-mongodb-lab"}'
本次稳定采集了 5 个入口,覆盖三类 MongoDB 形态:
mongo-single-37017       topology=single       component=mongod
mongo-rs0-primary-37117  topology=replica_set  component=mongod
mongo-rs0-secondary-37118 topology=replica_set component=mongod
mongo-mongos-37517       topology=sharded      component=mongos
mongo-configsvr-37217    topology=sharded      component=configsvr
这些实例的 mongodb_up 均为 1。如果还要直接采集 shard server,需要在对应 shard replica set 上单独准备可直连认证的监控账号;否则可以先通过 mongos 观察分片层面的 mongodb_mongos_sharding_* 指标。
8. 常用指标怎么看
实例是否可用
mongodb_up
mongodb_up = 1 表示 Categraf 能连接并完成基础采集。它是最适合做实例不可用告警的指标。
采集耗时
mongodb_scrape_use_seconds
如果采集耗时持续升高,要检查 MongoDB 本身是否变慢,也要检查是否开启了过多库表和索引采集。
连接数
mongodb_ss_connections{conn_type="current"}
mongodb_ss_connections{conn_type="available"}
连接数要结合应用连接池、mongos 数量、最大连接限制一起看。连接数长期升高,通常要排查连接泄漏、慢查询或突发流量。
操作速率
rate(mongodb_ss_opcounters[1m])
rate(mongodb_ss_metrics_document[5m])
这些指标可以看读写请求和文档层面的变化。突增时要结合业务发布时间线、慢查询和索引命中情况判断。
读写延迟
rate(mongodb_ss_opLatencies_latency[1m])
/
rate(mongodb_ss_opLatencies_ops[1m])
/ 1000
MongoDB 的 latency 原始单位通常是微秒,Dashboard 中会转换成毫秒。延迟升高时,需要联动看锁、WiredTiger cache、磁盘和慢操作。
WiredTiger cache
mongodb_ss_wt_cache_bytes_currently_in_the_cache
mongodb_ss_wt_cache_tracked_dirty_bytes_in_the_cache
rate(mongodb_ss_wt_cache_bytes_read_into_cache[5m])
rate(mongodb_ss_wt_cache_bytes_written_from_cache[5m])
缓存和脏页指标适合判断内存压力、刷盘压力和工作集是否超出内存。
复制延迟
mongodb_mongod_replset_member_replication_lag
副本集和 shard replica set 都应该看这个指标。延迟持续扩大时,要排查 Secondary 资源瓶颈、网络、oplog 压力和大批量写入。
9. Dashboard 导入
MongoDB 插件目录下提供了三份 Dashboard:
inputs/mongodb/dashboard.json
inputs/mongodb/dashboard2.json
inputs/mongodb/dashboard_grafana.json
三份文件的使用方式如下:
| 文件 | 平台 | 适用场景 |
|---|---|---|
dashboard.json |
夜莺 | 兼容较早夜莺大盘结构,使用当前 mongodb_ss_* 指标 |
dashboard2.json |
夜莺 v9 | 推荐用于夜莺 v9,已补 datasource、cluster、topology、component、instance 变量 |
dashboard_grafana.json |
Grafana | Grafana 导入使用,变量与夜莺 v9 版本保持一致 |
夜莺 v9 推荐导入:
Dashboards -> Import -> 选择 inputs/mongodb/dashboard2.json
如果需要在脚本或 CI 中更新已有夜莺 v9 大盘,可以直接调用 Nightingale API。夜莺 v9 中 Dashboard 的后端资源名是 board,大盘配置保存在 board_payload,更新配置的接口是:
PUT /api/n9e/board/:bid/configs
示例流程如下,把 <n9e>、<username>、<password> 和 <board_id> 替换成实际值:
TOKEN=$(curl -s -X POST 'http://<n9e>/api/n9e/auth/login' \
  -H 'Content-Type: application/json' \
  -d '{"username":"<username>","password":"<password>"}' \
  | jq -r '.dat.access_token')

jq -Rs '{configs: .}' inputs/mongodb/dashboard2.json > /tmp/mongodb-dashboard-payload.json

curl -X PUT "http://<n9e>/api/n9e/board/<board_id>/configs" \
  -H "Authorization: Bearer ${TOKEN}" \
  -H 'Content-Type: application/json' \
  --data-binary @/tmp/mongodb-dashboard-payload.json
更新后可以用下面的接口确认大盘配置已经写入:
curl -s "http://<n9e>/api/n9e/board/<board_id>" \
  -H "Authorization: Bearer ${TOKEN}" \
  | jq -r '.dat.configs' \
  | jq '.var | length, .panels | length'
如果使用较早版本夜莺,再尝试:
inputs/mongodb/dashboard.json
Grafana 导入:
inputs/mongodb/dashboard_grafana.json
导入后重点检查:
cluster变量是否能列出集群;topology是否能区分single、replica_set、sharded;component是否能区分mongod、mongos、configsvr、shardsvr;instance变量是否有值;mongodb_up面板是否为 1;- 副本集相关面板是否只在
mongod节点上有数据; mongos没有replSetGetStatus和 top 指标时,不要误判为空面板就是采集失败。
如果 Dashboard 变量为空,优先检查采集配置里的 cluster、topology、component 和 instance 标签。新版 Dashboard 的变量来自 mongodb_up,只要 mongodb_up{cluster="..."} 能查到,这几个下拉变量通常就能正常出现。
三种 MongoDB 拓扑在大盘里的推荐选择方式:
| 拓扑 | 采集标签 | 大盘变量选择 | 重点面板 |
|---|---|---|---|
| 单节点 | topology="single"、component="mongod" |
cluster 选目标集群,topology 选 single,component 选 mongod,instance 选单节点实例 |
Up、Uptime、Connections、Command Operations、Document Operations、Query Efficiency、Cache Size、WiredTiger Tickets Available、Database Size、Index Access Rate |
| 副本集 | topology="replica_set"、component="mongod"、replset="rs0" |
topology 选 replica_set,component 选 mongod,instance 可以选 Primary 或多个成员 |
基础面板、Replset Election、Replset Lag Seconds、Replset Member State、Replset Member Health、Oplog Window、Oplog Used Bytes |
| 分片集群 | topology="sharded",并用 component 区分 mongos、configsvr、shardsvr |
先用 component="mongos" 看路由层和分片概览,再用 configsvr / shardsvr 看内部副本集节点 |
Shard / Collection Counts、Chunk Distribution、Balancer Status、Total Chunks、连接数、WiredTiger、副本集延迟 |
从 MongoDB 生产排障角度看,Dashboard 覆盖了三类拓扑的关键入口:
| 监控面 | 单节点 | 副本集 | 分片集群 |
|---|---|---|---|
| 存活和基础资源 | Up、Uptime、Memory、Connections、Network I/O |
同单节点 | mongos、configsvr、shardsvr 分别通过相同基础面板查看 |
| 请求和查询效率 | Command Operations、Document Operations、Response Time、Query Efficiency、Cursors |
同单节点,并可对 Primary/Secondary 分别查看 | mongos 看路由入口请求,shard 节点看实际读写和执行效率 |
| 存储引擎压力 | Cache Size、Cache I/O、Cache Dirty Pages Rate、Cache Evicted Pages、WiredTiger Tickets Available、WiredTiger Tickets Out、WiredTiger Checkpoint Time |
同单节点 | 在 configsvr / shardsvr 上查看,mongos 没有 WiredTiger 存储层指标 |
| 库表和索引 | Database Size、Collections / Indexes、Index Access Rate |
同单节点 | mongos 可看全局库表视角,shard 节点可看实际存储分布 |
| 复制集健康 | 不适用 | Replset Election、Replset Lag Seconds、Replset Member State、Replset Member Health、Oplog Window、Oplog Used Bytes |
config server replica set 和 shard replica set 都按副本集方式查看 |
| 分片状态 | 不适用 | 不适用 | Shard / Collection Counts、Chunk Distribution、Balancer Status、Total Chunks |
如果只采集 mongos,大盘能展示路由层连接、请求和部分分片统计,但看不到 shard 内部的 WiredTiger cache、oplog 和复制延迟。要完整覆盖分片集群,建议给每个 shard replica set 的 Primary 和至少一个 Secondary 都配置采集入口,并确保监控账号可以直连认证。
下面是本次测试环境中,Categraf 采集 MongoDB 指标并导入夜莺 v9 大盘后的三种拓扑效果。
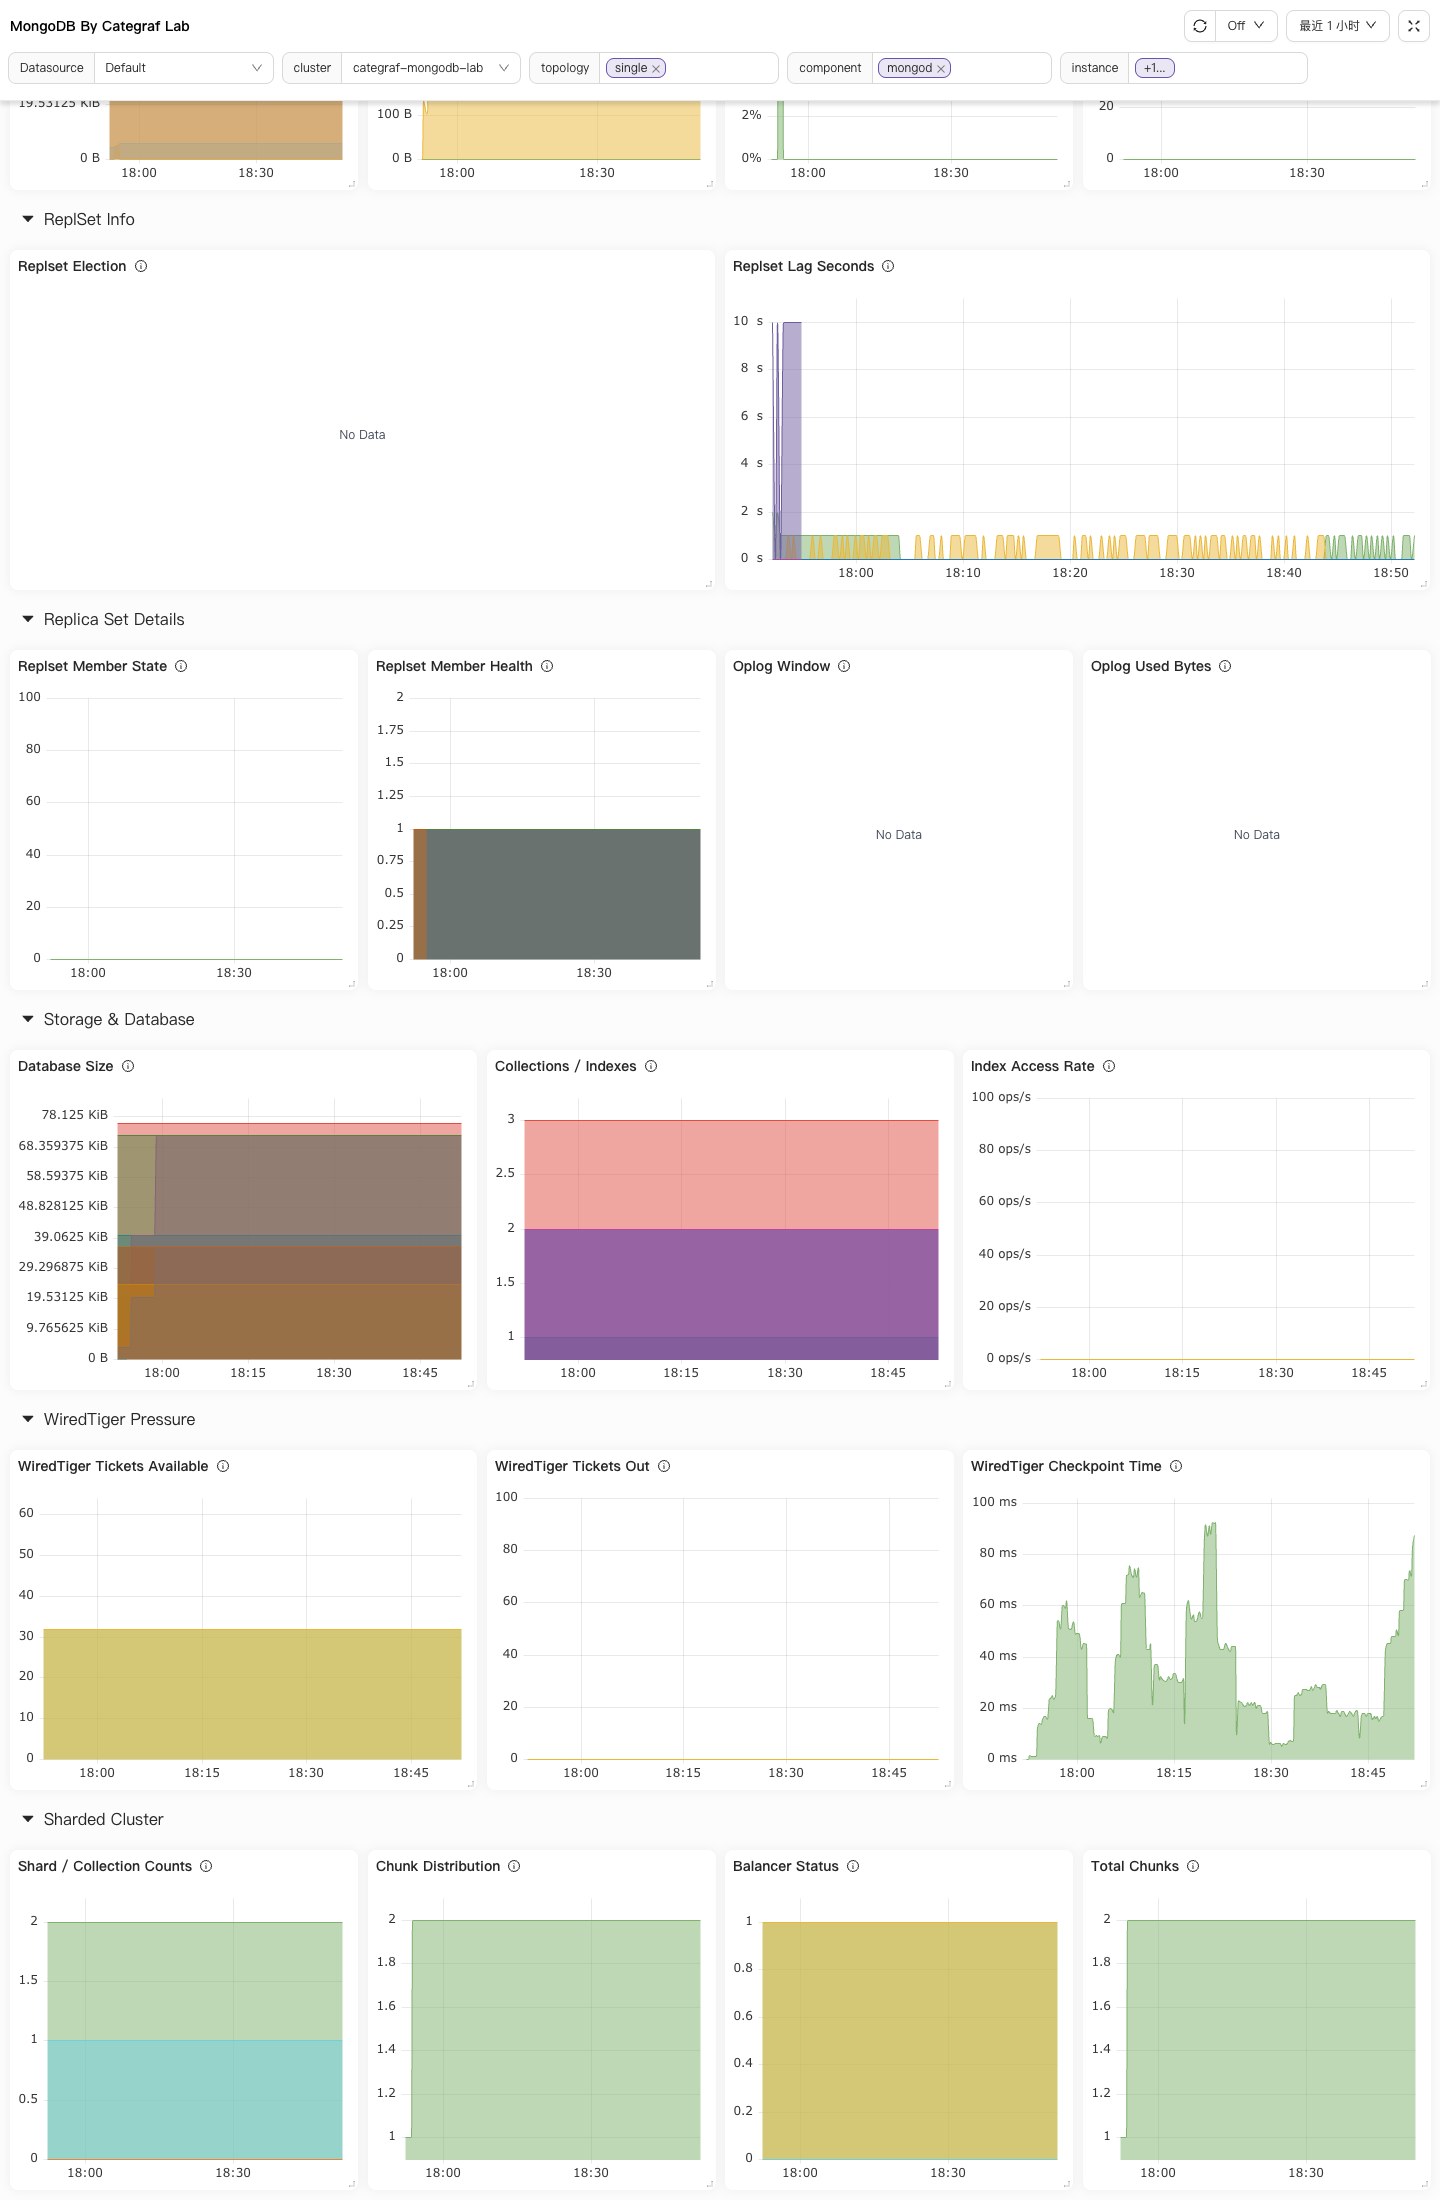
单节点大盘
变量选择:cluster=categraf-mongodb-lab、topology=single、component=mongod、instance=mongo-single-37017。单节点没有复制集状态,重点看存活、连接数、内存、网络、命令和文档操作等基础指标。
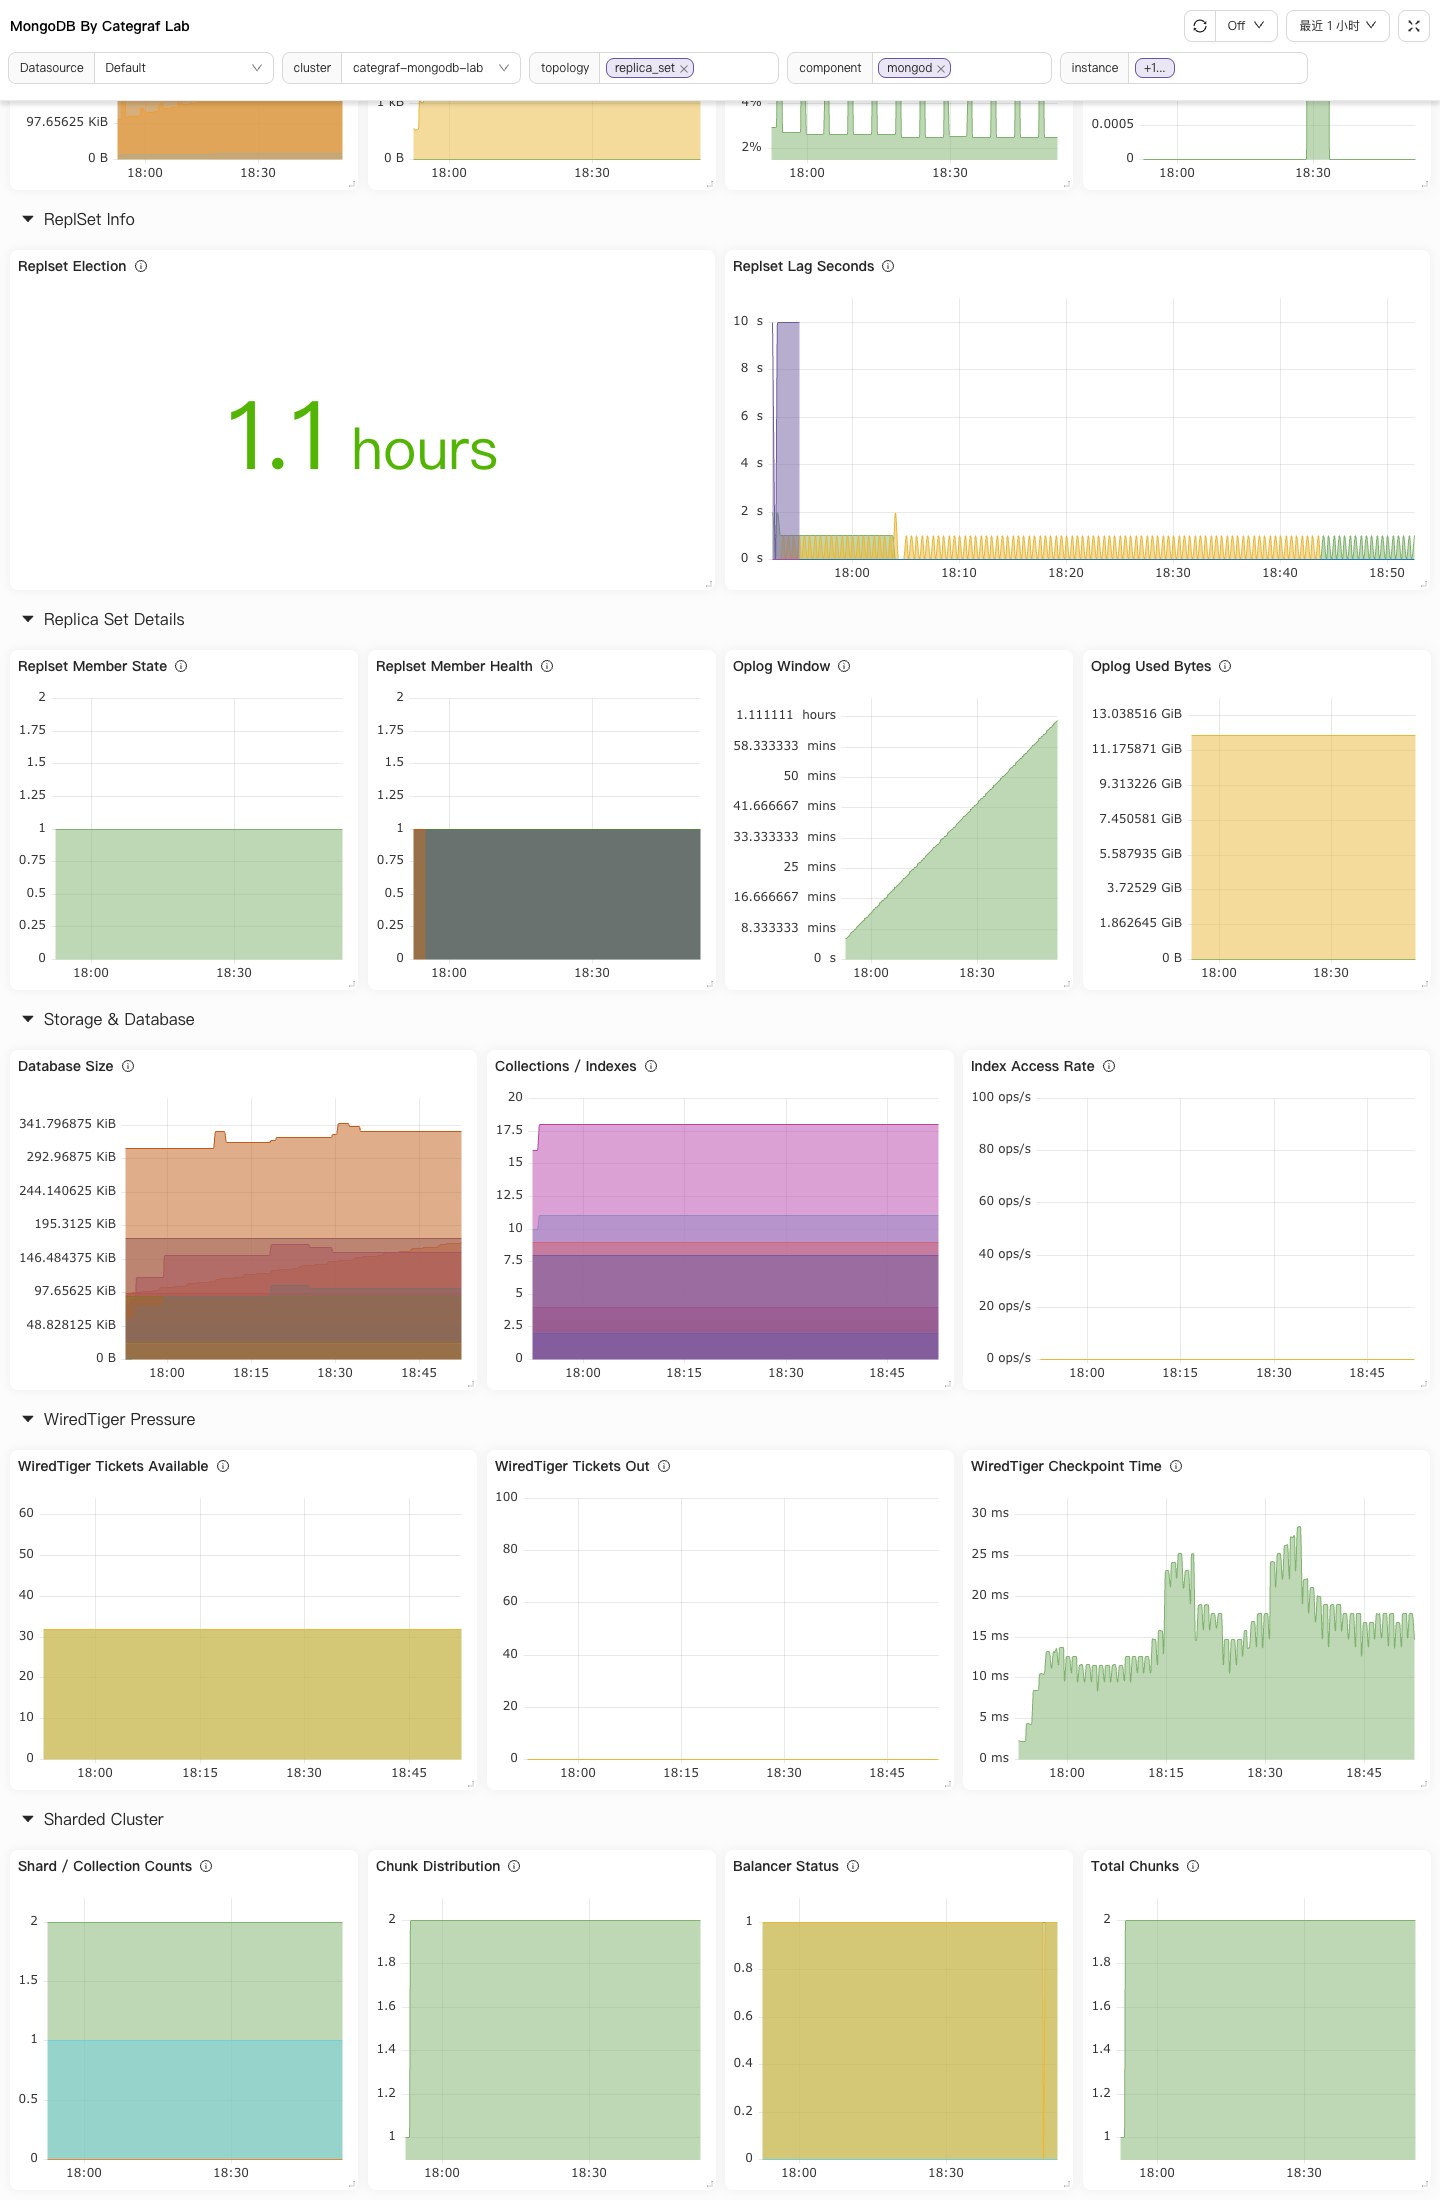
副本集大盘
变量选择:cluster=categraf-mongodb-lab、topology=replica_set、component=mongod、instance=mongo-rs0-primary-37117。副本集除了基础指标,还要重点看 Replset Election 和 Replset Lag Seconds,用于判断主从切换和复制延迟。
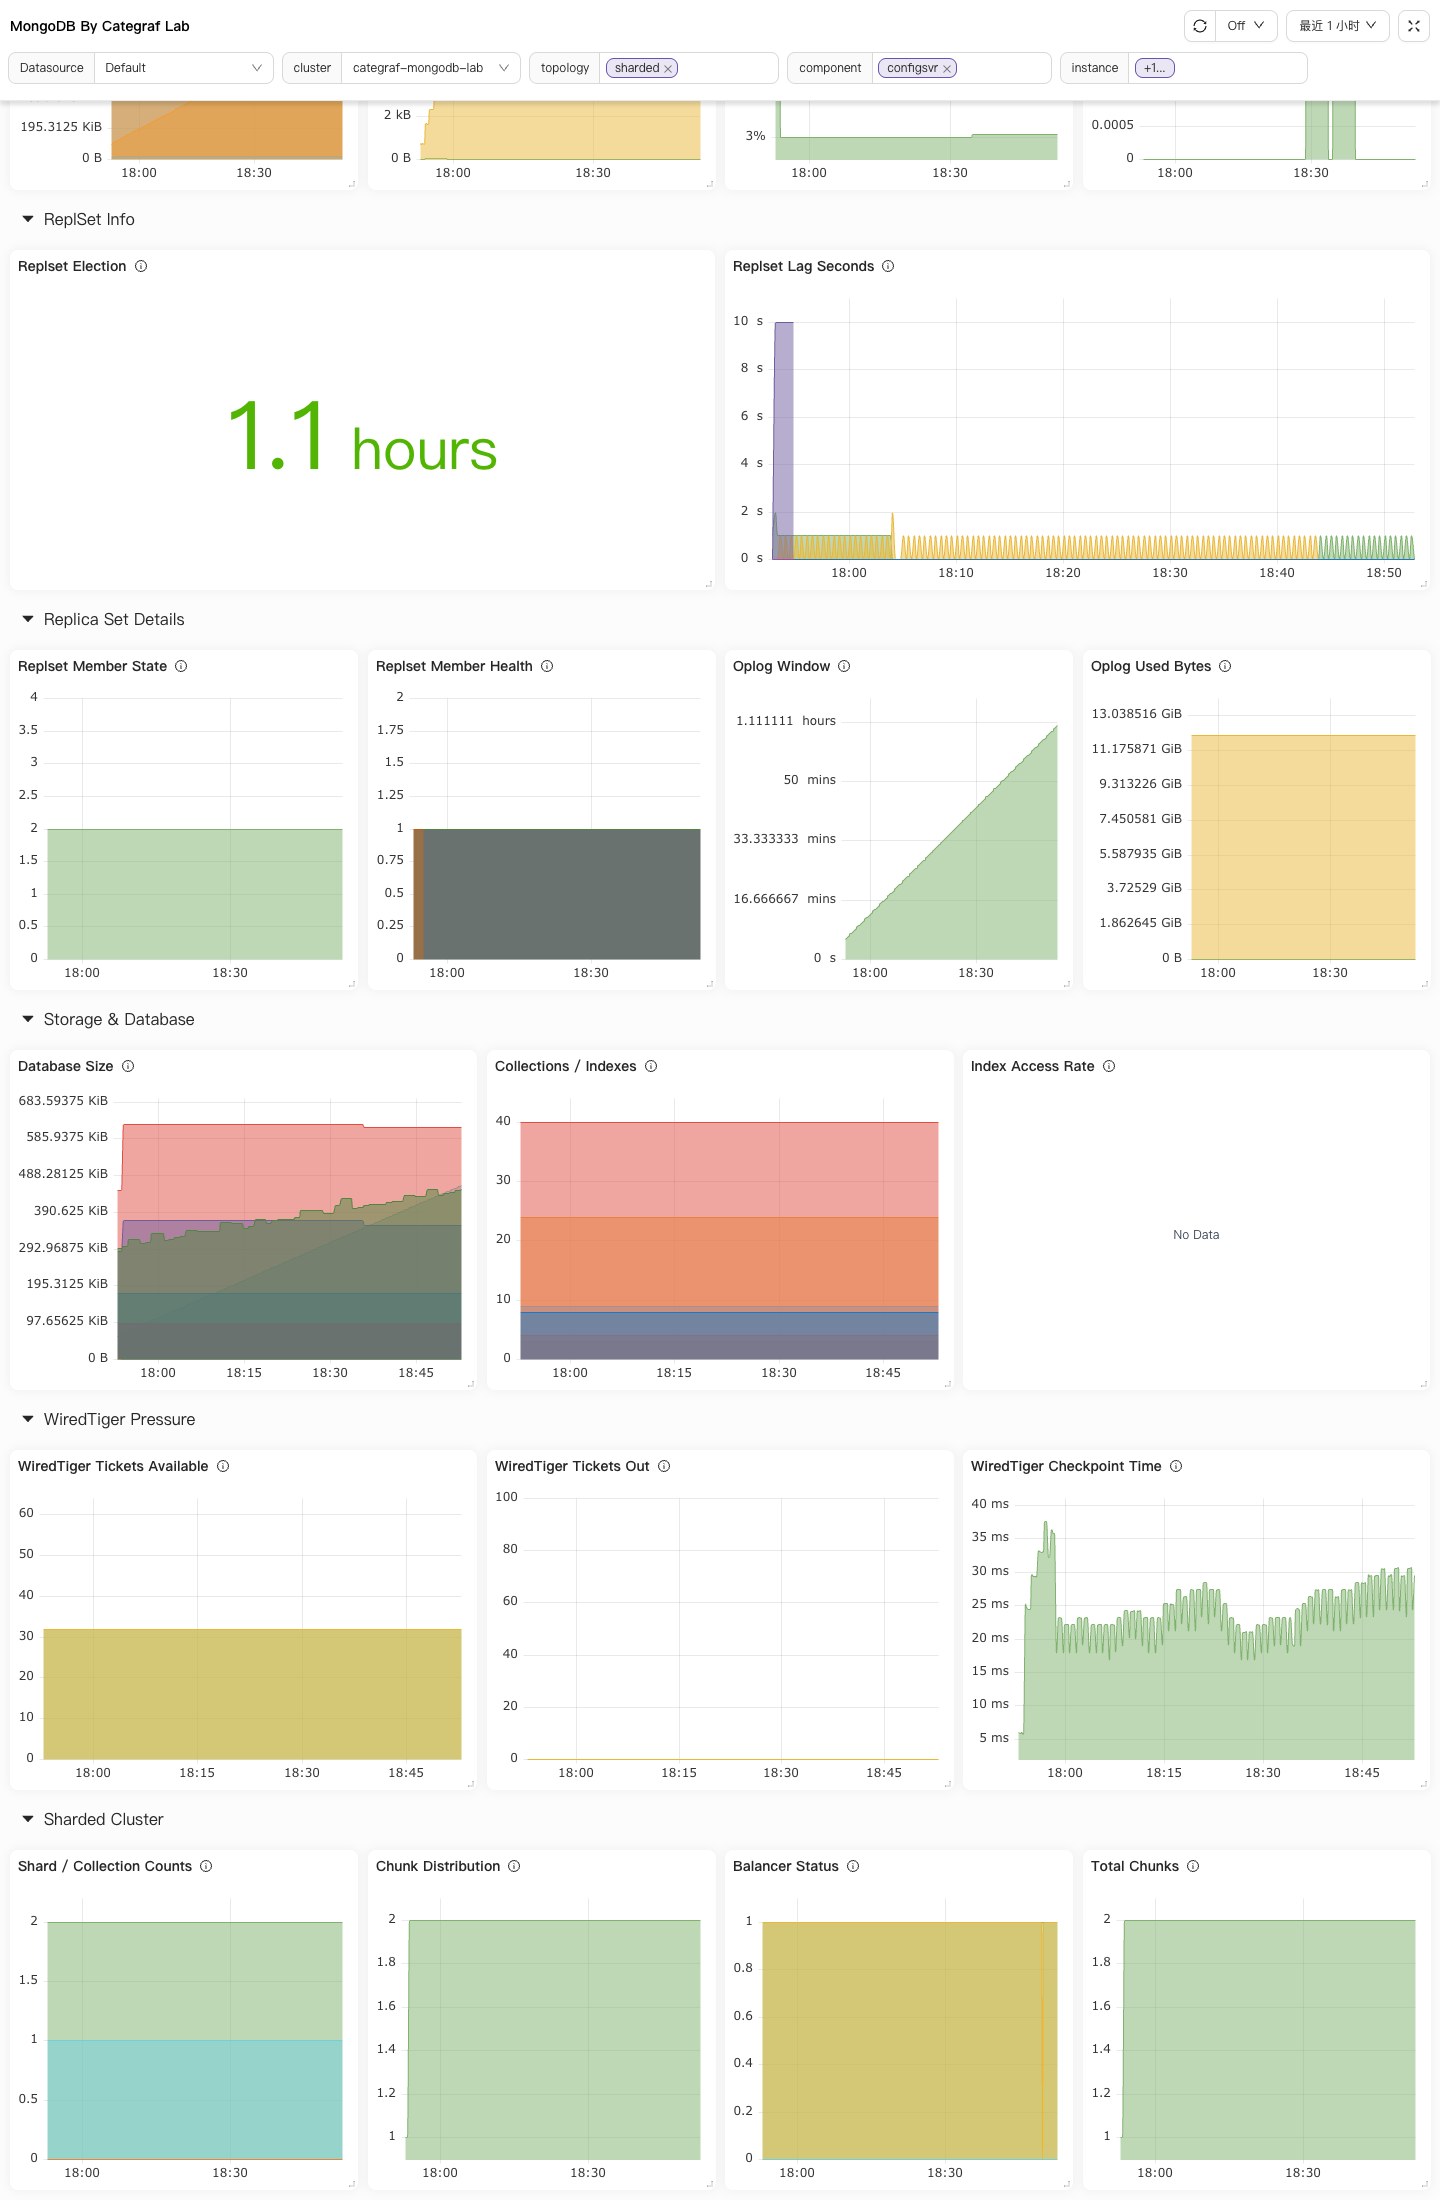
分片集群大盘
变量选择:cluster=categraf-mongodb-lab、topology=sharded、component=configsvr、instance=mongo-configsvr-37217。分片集群建议分别查看 mongos、configsvr 和 shardsvr:mongos 适合看路由层和分片概览,configsvr / shardsvr 才能看到 WiredTiger、oplog、复制延迟等 mongod 内部指标。
10. 告警建议
Categraf 仓库里已经提供 MongoDB 告警规则:
inputs/mongodb/alerts.json
常见告警方向:
| 问题 | PromQL 示例 |
|---|---|
| 实例不可用 | mongodb_up < 1 |
| 刚刚重启 | mongodb_ss_uptime < 60 |
| 复制延迟过高 | mongodb_mongod_replset_member_replication_lag > 30 |
| 连接数过高 | 当前连接数 / 可用连接数超过阈值 |
| 游标超时 | rate(mongodb_ss_metrics_cursor_timedOut[5m]) > 0 |
| 操作延迟高 | 平均 op latency 超过业务阈值 |
| Assert 异常 | rate(mongodb_ss_asserts[5m]) > 0 |
生产环境不要直接照搬阈值。复制延迟 30 秒对核心交易库可能已经很严重,对离线分析库可能只是低优先级事件。连接数阈值也要结合实例规格和连接池策略调整。
11. 生产建议
标签先设计好
建议至少设置:
labels = {
  cluster = "prod-mongo-a",
  instance = "mongo-a-01:27017",
  topology = "replica_set",
  replset = "rs0"
}
分片集群再补:
component = "mongos" # 或 configsvr / shardsvr
不要无脑全开库表和索引采集
collect_all = true 适合测试和中小规模环境。生产环境集合数量很多时,建议评估采集耗时和时序基数,必要时改成:
collect_all = false
enable_diagnostic_data = true
enable_replicaset_status = true
enable_db_stats = true
enable_coll_stats = true
coll_stats_namespaces = ["categraf_demo.orders"]
enable_index_stats = true
index_stats_collections = ["categraf_demo.orders"]
副本集和分片要分别采
只采 mongos 看不到 shard 内部的复制延迟、WiredTiger cache、成员状态。分片集群建议同时采集:
- 每个
mongos; - config server replica set 的关键节点;
- 每个 shard replica set 的 Primary 和至少一个 Secondary。
权限按采集范围授予
基础采集可以从 clusterMonitor、read local 开始。启用库表和索引采集时,再补目标库 read 或 readAnyDatabase。权限不足时,常见现象不是 mongodb_up = 0,而是部分库表指标缺失,并在日志里看到 listCollections 未授权。
12. 本次验证结论
本次使用 Docker 搭建了单节点、三节点副本集和最小分片集群,并用当前仓库构建的 Categraf 完成验证:
mongodb_up在单节点、副本集、mongos、config server、shard server 上均为1;mongodb_ss_uptime、连接数、WiredTiger、op counters 等基础指标正常输出;- 副本集相关指标在
mongod节点可采集; - Categraf 短跑写入测试后端后,可以从 Prometheus 查询端点查到
mongodb_up{cluster="categraf-mongodb-lab"}; collect_all = true需要额外注意库表发现权限和采集成本。
MongoDB 监控落地时,最重要的不是把所有指标一次性打开,而是先把拓扑、标签、权限和 Dashboard 变量设计清楚。只要这些基础正确,后续再扩展库表、索引、慢操作和告警规则就会顺很多。






