这是 MongoDB 监控系列文章的第六篇,前面几篇文章的链接如下:
之前的文章中我们尝试使用 Percona 提供的最新版 MongoDB Exporter 来采集 MongoDB 的数据,成功了,但是这个 Exporter 不同的版本指标有变化,在 Grafana 上面找不到合适的模板,所以我们尝试使用 cprobe 作为采集器,抓取 MongoDB 监控数据。cprobe 默认提供的模板是 OK 的。本文继续尝试一个新的采集器:categraf,categraf 默认也提供了 MongoDB 的采集器,categraf 通常和夜莺一起使用,夜莺的内置模板中也提供了 MongoDB 的模板。
核心要点摘要
- 本文使用 Categraf 的
input.mongodb插件采集 MongoDB 监控数据,并写入夜莺展示。 - Categraf 配置重点在
conf/input.mongodb/mongodb.toml,其中labels.instance对仪表盘很关键。 ./categraf --test --inputs mongodb可以先验证 MongoDB 指标是否能正常采集,再正式启动采集进程。- 夜莺可以用 docker compose 快速启动测试环境,再通过内置或集成仓库里的 MongoDB 仪表盘 JSON 展示数据。
- 本文重点是验证 Categraf + 夜莺链路,不是生产环境部署手册;生产环境安装方式、凭据管理和高可用还要单独设计。
categraf 安装配置
categraf 下载可以从两个地方:
基本的使用方法可以参考这个 文档
解压缩 categraf,MongoDB 的配置在 conf 目录下的 input.mongodb 下的 mongodb.toml,我的配置内容如下:
[[instances]]
# log level, enum: panic, fatal, error, warn, warning, info, debug, trace, defaults to info.
log_level = "info"
# append some const labels to metrics
# NOTICE! the instance label is required for dashboards
labels = { instance="mongo-cluster-01" }

# mongodb dsn, see https://www.mongodb.com/docs/manual/reference/connection-string/
mongodb_uri = "mongodb://127.0.0.1:27017"
# mongodb_uri = "mongodb://127.0.0.1:27017"
# if you don't specify the username or password in the mongodb_uri, you can set here.
# This will overwrite the dsn, it would be helpful when special characters existing in the username or password and you don't want to encode them.
# NOTICE! this user must be granted enough rights to query needed stats, see ../inputs/mongodb/README.md
username = "exporteruser"
password = "MhxzKhl"
# if set to true, use the direct connection way
# direct_connect = true

# collect all means you collect all the metrics, if set, all below enable_xxx flags in this section will be ignored
collect_all = true
# if set to true, collect databases metrics
# enable_db_stats = true
# if set to true, collect getDiagnosticData metrics
# enable_diagnostic_data = true
# if set to true, collect replSetGetStatus metrics
# enable_replicaset_status = true
# if set to true, collect top metrics by admin command
# enable_top_metrics = true
# if set to true, collect index metrics. You should specify one of the coll_stats_namespaces and the discovering_mode flags.
# enable_index_stats = true
# if set to true, collect collections metrics. You should specify one of the coll_stats_namespaces and the discovering_mode flags.
# enable_coll_stats = true

# Only get stats for the collections matching this list of namespaces. if none set, discovering_mode will be enabled.
# Example: db1.col1,db.col1
# coll_stats_namespaces = []
# Only get stats for index with the collections matching this list of namespaces.
# Example: db1.col1,db.col1
# index_stats_collections = []
# if set to true, replace -1 to DESC for label key_name of the descending_index metrics
# enable_override_descending_index = true

# which exposes metrics with 0.1x compatible metric names has been implemented which simplifies migration from the old version to the current version.
# compatible_mode = true
配置完了之后做个测试:
./categraf --test --inputs mongodb
如果正常打印出一些 MongoDB 的监控数据,那就说明正常采集到数据了。
| 步骤 | 目标 | 验证方式 |
|---|---|---|
配置 mongodb.toml |
让 Categraf 知道 MongoDB 地址、账号和采集开关 | 检查 mongodb_uri、username、password、collect_all |
| 执行测试命令 | 验证插件能采到数据 | ./categraf --test --inputs mongodb 正常输出指标 |
| 启动 Categraf | 持续采集 MongoDB 数据 | ./categraf --inputs mongodb |
| 导入夜莺仪表盘 | 展示 MongoDB 指标 | 夜莺页面能看到 MongoDB 仪表盘数据 |
为了方便验证,我会用 docker compose 启动一个夜莺,然后把 categraf 采集的 MongoDB 监控数据写到夜莺中,然后使用夜莺的内置模板来展示 MongoDB 的监控数据。
夜莺安装配置
我们的重点还是探索 MongoDB 的监控,并非为了深入研究夜莺,所以我们直接使用 docker compose 方式快速启动夜莺。如果是生产环境建议大家使用二进制的方式安装,可以提供更好的性能和稳定性。个人也不建议把夜莺安装在 Kubernetes 中,因为监控系统是一个 P0 系统,优先级极高,如果安装在 Kubernetes 中,Kubernetes 挂了就会影响监控,这个时候容易被其他团队怼。
我们可以从夜莺的 github release 页面下载最新的版本,也可以从国内 Flashcat 的下载中心下载。下载中心提供两个包:
- n9e-v7.6.0-linux-arm64.tar.gz
- n9e-v7.6.0-linux-amd64.tar.gz
我是 Macbook,虽然不是 Linux,其实下载任意一个包都是可以的,因为我不使用发布包中的二进制,而仅仅是使用发布包中的 docker compose 文件和相关配置。这里我姑且下载 n9e-v7.6.0-linux-arm64.tar.gz,然后解压缩,进入 docker/compose-bridge 目录,然后使用 docker compose 启动夜莺即可:
docker compose up -d
注意夜莺提供的 docker compose 会自动启动 redis 和 mysql,如果你的机器上原本有 redis 和 mysql,那么请先停掉原来的 redis 和 mysql,或者修改 docker compose 文件中的端口映射。
之后,你就可以通过浏览器访问 http://localhost:17000(localhost只是个样例,请自行换成你的夜莺所在机器的 IP),使用 root/root.2020 登录夜莺了。
categraf 修改配置适配夜莺
categraf 的默认配置目录是 conf 目录,conf 下有个 config.toml,里边配置了夜莺服务端的地址,因为默认就是 127.0.0.1,所以也无需改动。如果你的 categraf 和夜莺不是在一台机器上,就要把 config.toml 中的地址改成夜莺所在机器的 IP。
然后就可以启动 categraf 了:
./categraf --inputs mongodb
通过 --inputs mongodb 参数,categraf 只会采集 MongoDB 的监控数据,如果不加这个参数,categraf 会自动查看 conf 目录中 input 打头的所有的插件,启动所有的正常配置的插件。
在夜莺中添加 MongoDB 仪表盘
然后登录夜莺,进入仪表盘页面,选中左侧业务组,右侧会有一个导入按钮,点击导入:
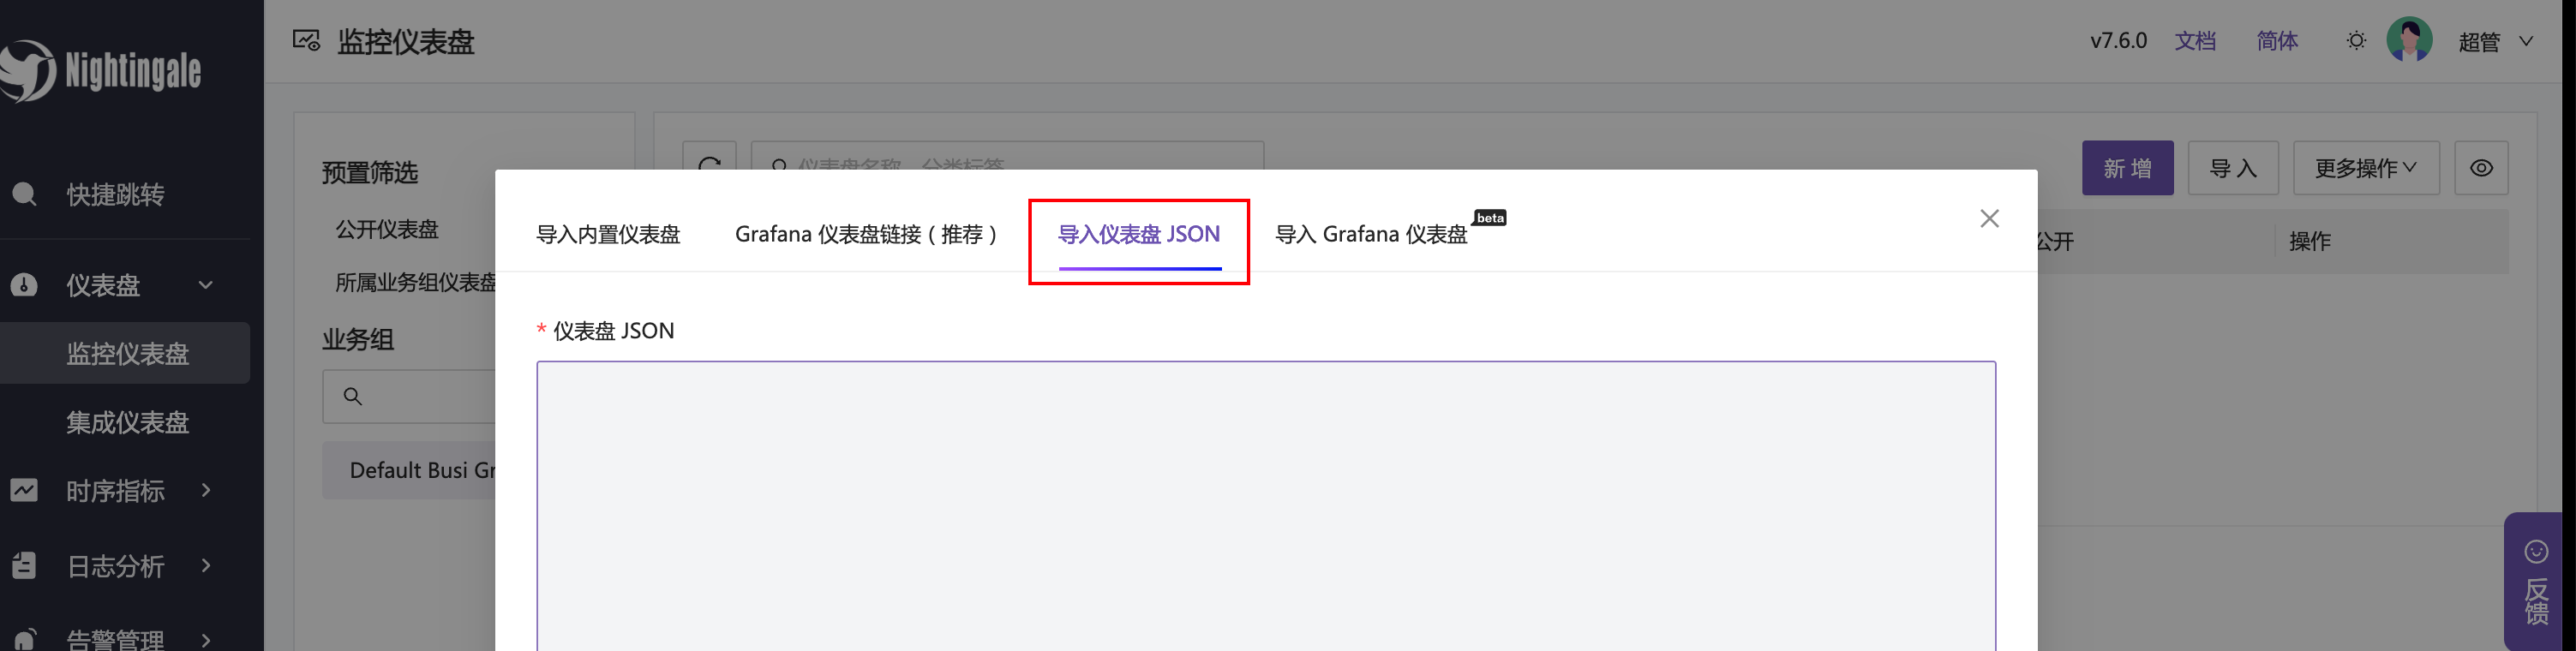
选择导入仪表盘 JSON,然后导入 这个 MongoDB 仪表盘 的内容。之后打开仪表盘可以看到类似如下内容:
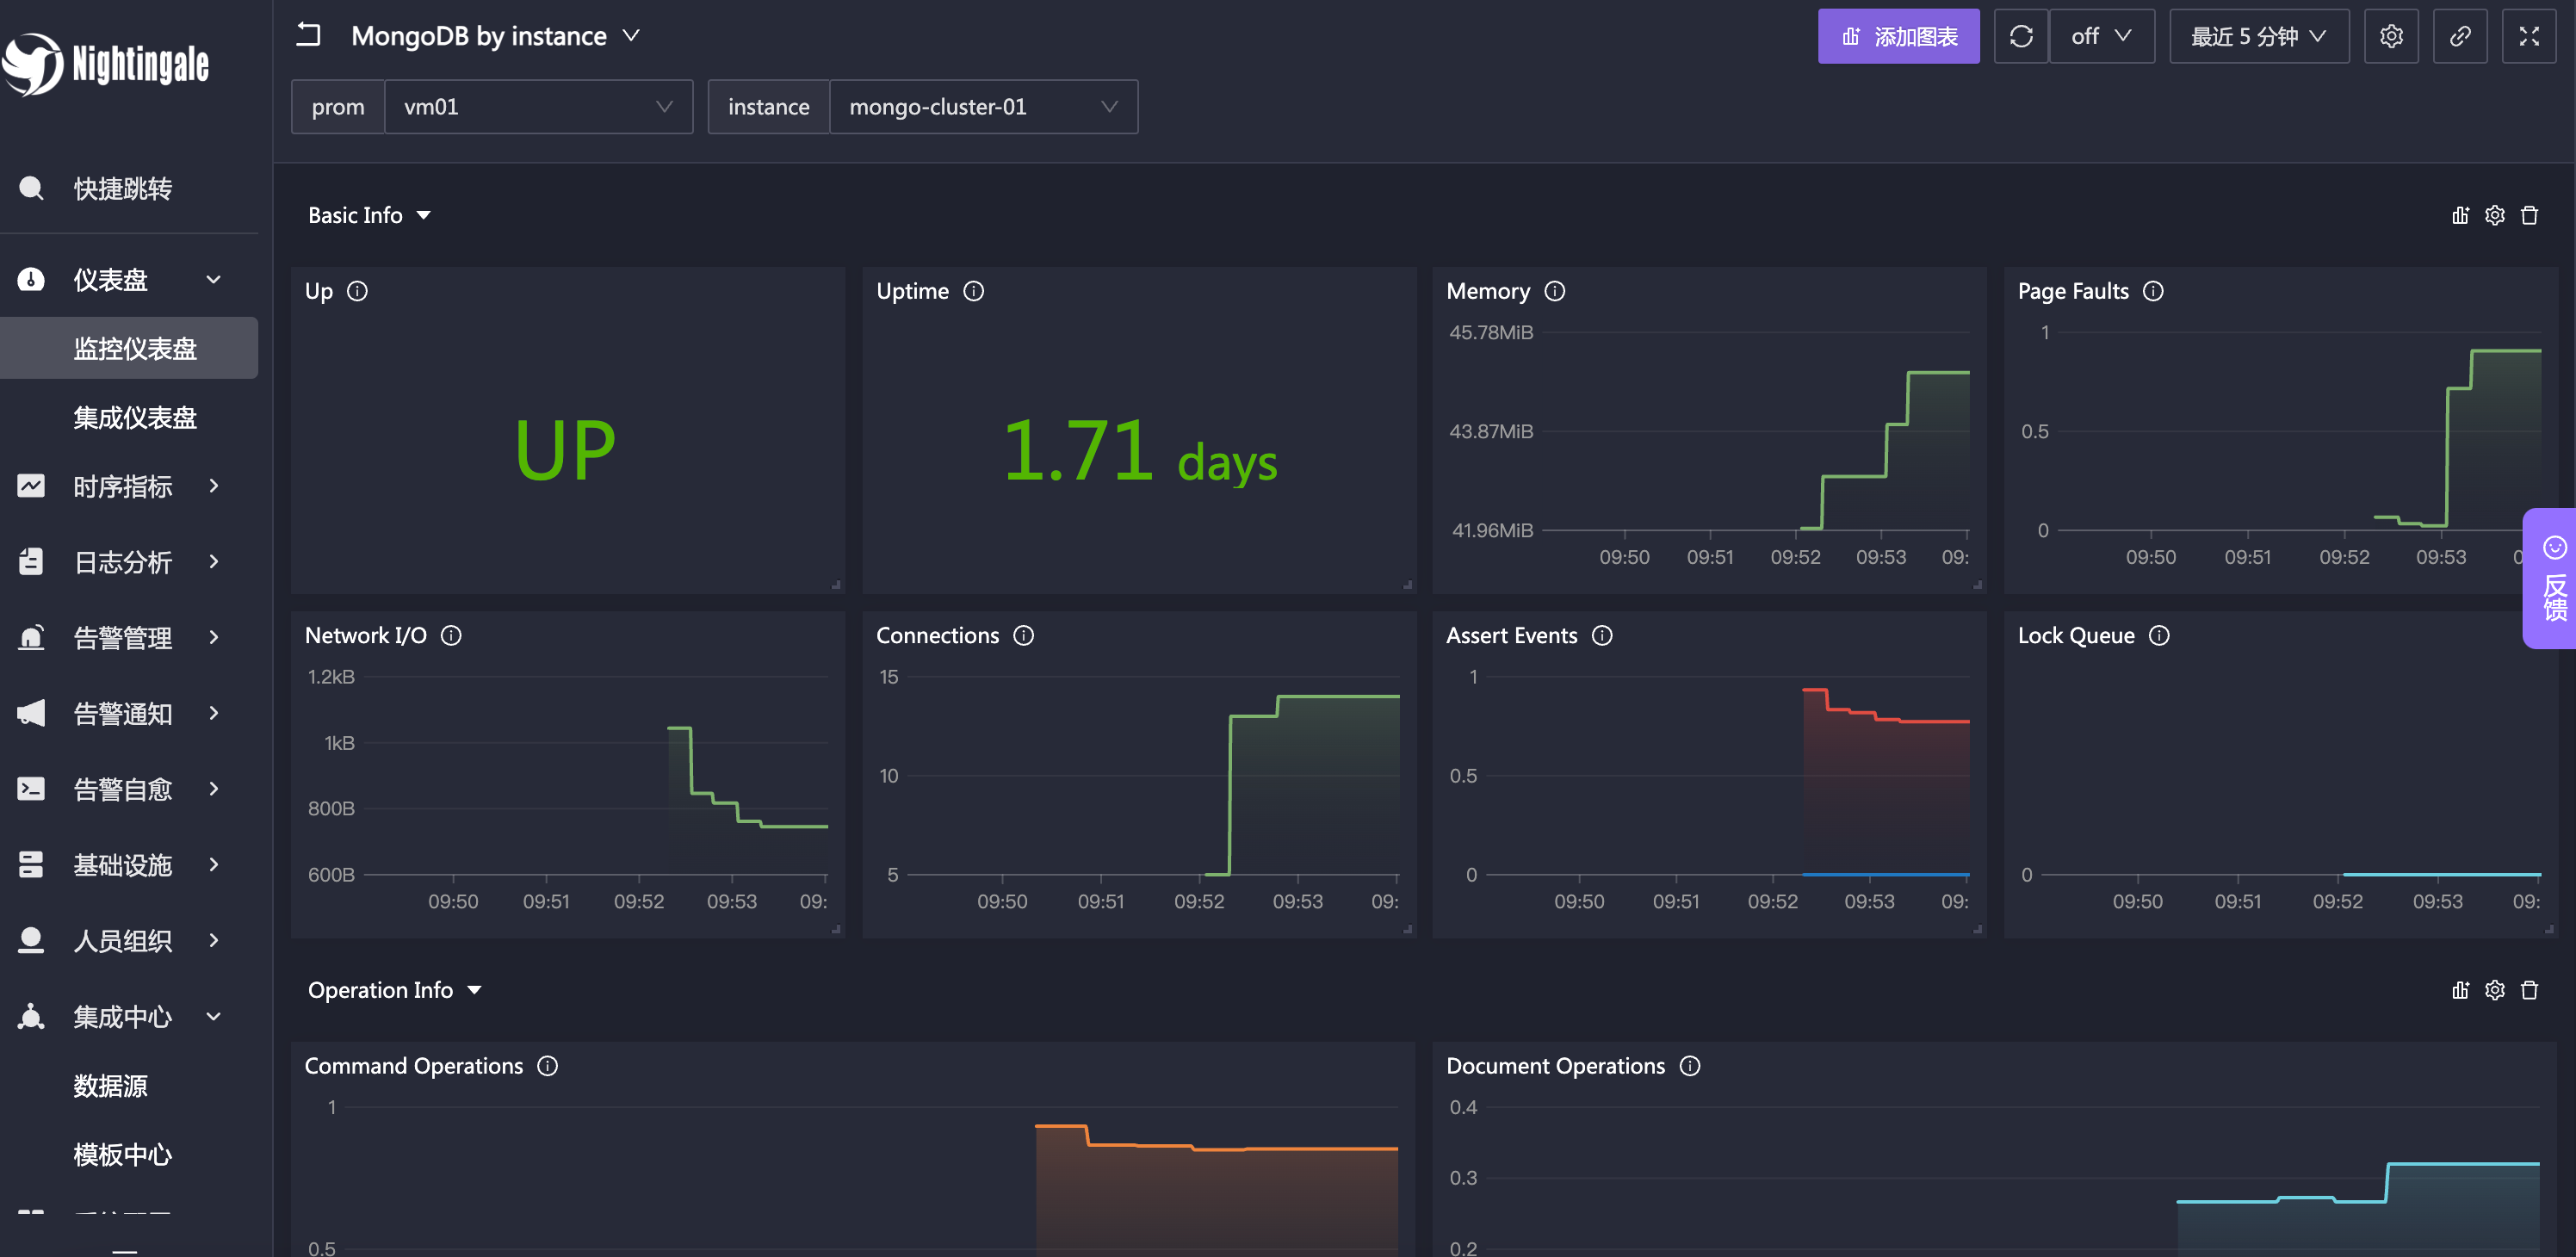
OK,这就完成了 MongoDB 基本的数据采集和展示。
总结
Categraf 是一个轻量级的监控数据采集器,配置文件比较直观,也提供了很多插件,可以采集各种各样的监控数据。Categraf 通常和夜莺一起使用,夜莺的内置模板中也提供了 MongoDB 模板,可以直接使用。
这篇文章尝试了 Categraf 采集 MongoDB 监控数据,并在夜莺中展示。到这里,MongoDB 的基础采集链路已经跑通:MongoDB 提供状态数据,Categraf 负责采集,夜莺负责接收和展示。后面我们会研究仪表盘中有哪些监控指标,从中了解 MongoDB 的重要指标。
FAQ
Q1:为什么 Categraf 配置里强调 instance 标签?
A:配置注释里也写了,instance 标签对 dashboards 是必需的。很多仪表盘会依赖这个标签来区分实例和筛选数据。
Q2:--test --inputs mongodb 有什么作用?
A:它可以只测试 MongoDB 插件是否能采集到数据,适合在正式启动前排查地址、账号、权限和配置问题。
Q3:本文的 docker compose 夜莺适合生产环境吗?
A:本文只是为了快速验证 MongoDB 监控链路。生产环境建议结合实际可用性、性能、数据存储、备份、凭据管理和部署架构来设计。