
这是 MongoDB 监控系列文章的第五篇,前面几篇文章的链接如下:
按照系列之前的文章,咱们已经大概了解了 MongoDB Exporter 的使用方法,并且采集到了指标数据。接下来,我们将使用 Prometheus 把 MongoDB Exporter 的数据抓取过来,然后使用 Grafana 渲染。
核心要点摘要
- 本文先把 MongoDB Exporter 暴露的
localhost:9216配到 Prometheus 抓取目标中,并在 Targets 页面确认状态为UP。 - Grafana 官方或社区 MongoDB 仪表盘可能因为指标命名不匹配而没有数据,所以不能只看“是否导入成功”。
- 通过 PromQL 正则可以观察
mongodb_opcounters.*和mongodb_metrics_document_.*等指标族,理解它们大致代表操作计数和文档统计。 - 为了获得更匹配的仪表盘,本文继续尝试 Cprobe 的 MongoDB 插件,并通过 remote write 把指标写入 Prometheus。
- Cprobe 提供了 MongoDB Grafana 仪表盘,但仪表盘出来不代表监控完成,后续仍要理解每个关键指标的含义。
Prometheus 安装配置
Prometheus 的安装极为简单,一行命令即可启动,这里不再赘述,把 MongoDB Exporter 的地址配置到 Prometheus 的抓取配置中,让 Prometheus 定时抓取 MongoDB Exporter 的数据。
scrape_configs:
  - job_name: "mongodb_exporter"
    static_configs:
      - targets: ["localhost:9216"]
重新启动 Prometheus 或者给 Prometheus 发个 HUP 信号:
kill -HUP $(pidof prometheus)
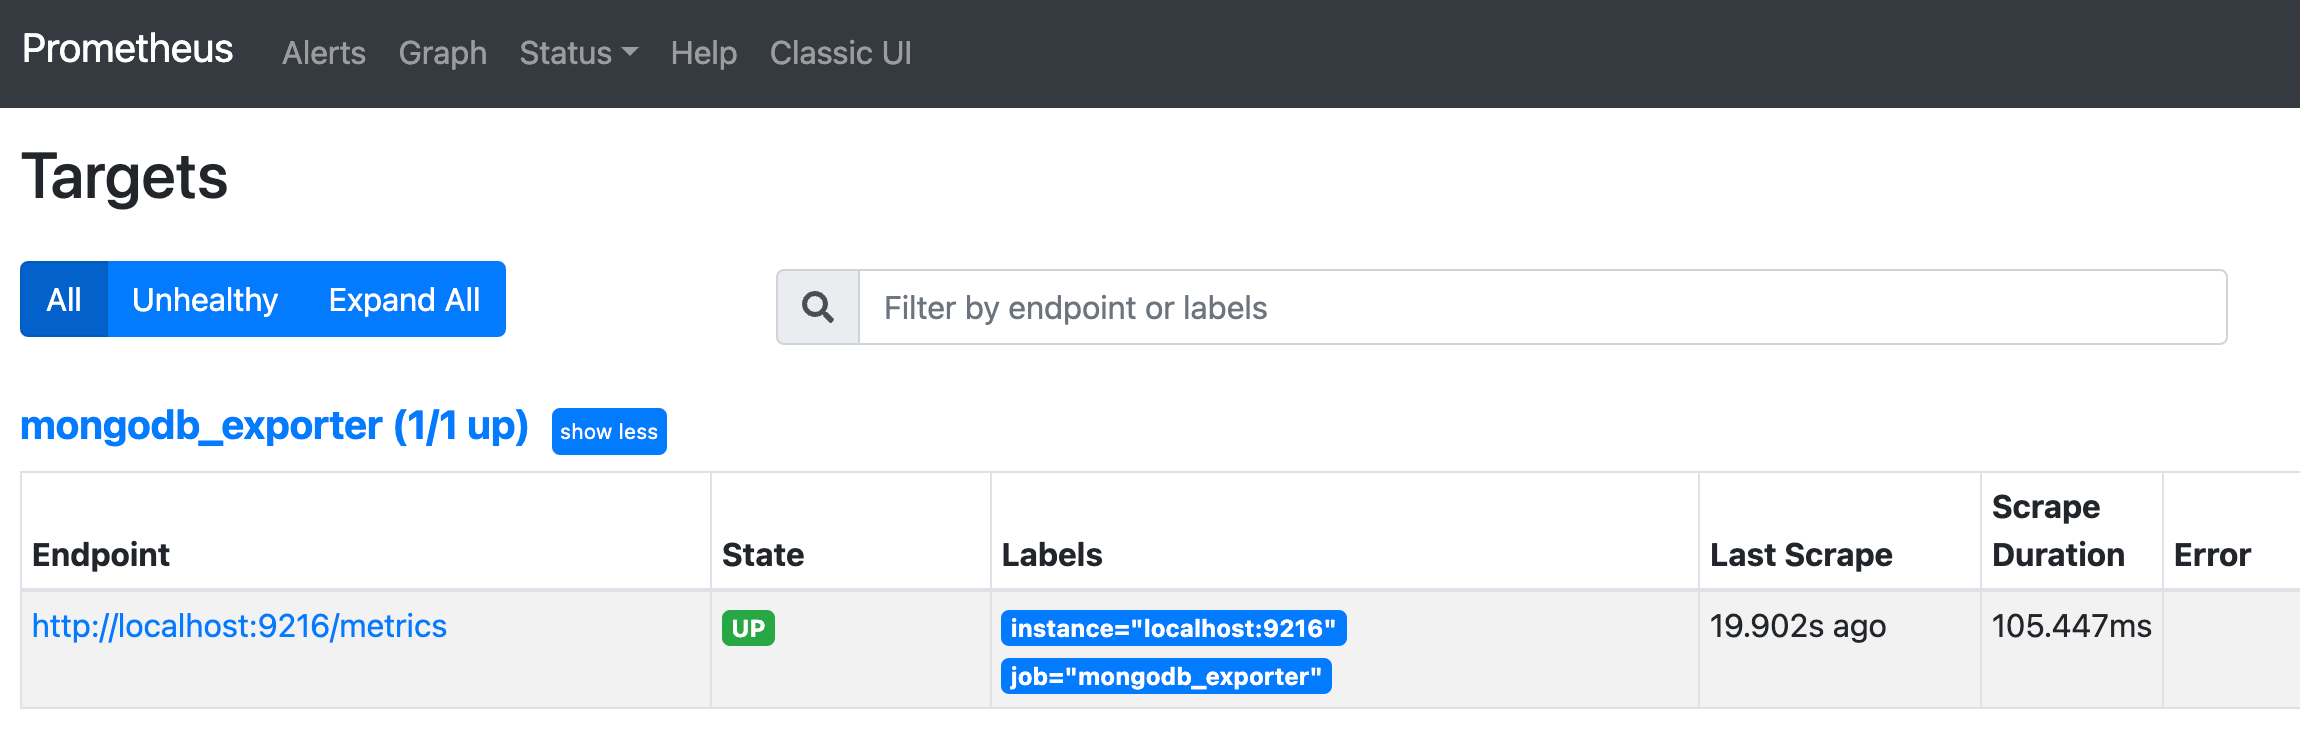
稍等片刻,打开 Prometheus 的 Web 界面,查看 Targets,可以看到 MongoDB Exporter 的状态是 UP。
随便查一个 MongoDB 的指标:
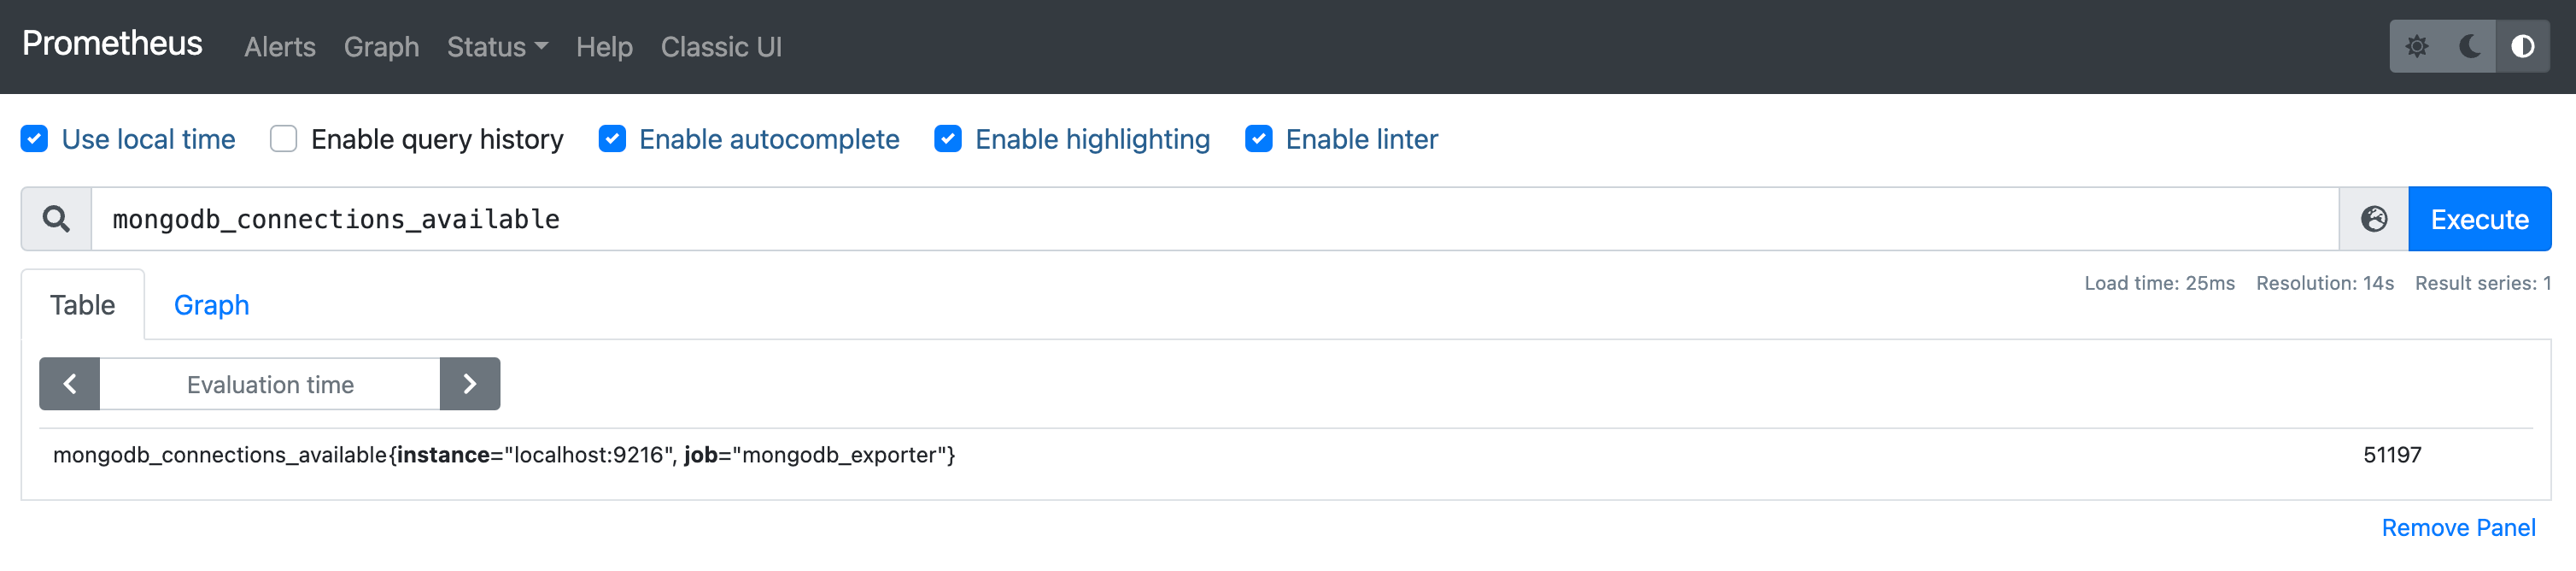
看起来数据采集到了,接下来我们使用 Grafana 来渲染这些数据。
Grafana 安装配置
遗憾,我去 Grafana 官网搜索了几个 MongoDB 的仪表盘,基本都没有数据,原因是指标名字对不上。不过,从仪表盘上可以看出哪些指标比较关键,即:值得放到仪表盘上面的指标,通常都是需要大家关注的。下面我们简单做个梳理。
| 指标族 | 查询方式 | 本文观察到的含义 |
|---|---|---|
mongodb_opcounters.* |
{__name__=~"mongodb_opcounters.*"} |
各类操作数量统计,例如 insert、query、update、delete 等 |
mongodb_metrics_document_.* |
{__name__=~"mongodb_metrics_document_.*"} |
文档相关统计,例如 deleted、inserted、returned、updated |
opcounters 相关
通过下面的 promql 可以正则匹配:
{__name__=~"mongodb_opcounters.*"}
得到如下结果:
- mongodb_opcountersRepl_command{instance=“localhost:9216”, job=“mongodb_exporter”}
- mongodb_opcountersRepl_delete{instance=“localhost:9216”, job=“mongodb_exporter”}
- mongodb_opcountersRepl_getmore{instance=“localhost:9216”, job=“mongodb_exporter”}
- mongodb_opcountersRepl_insert{instance=“localhost:9216”, job=“mongodb_exporter”}
- mongodb_opcountersRepl_query{instance=“localhost:9216”, job=“mongodb_exporter”}
- mongodb_opcountersRepl_update{instance=“localhost:9216”, job=“mongodb_exporter”}
- mongodb_opcounters_command{instance=“localhost:9216”, job=“mongodb_exporter”}
- mongodb_opcounters_delete{instance=“localhost:9216”, job=“mongodb_exporter”}
- mongodb_opcounters_getmore{instance=“localhost:9216”, job=“mongodb_exporter”}
- mongodb_opcounters_insert{instance=“localhost:9216”, job=“mongodb_exporter”}
- mongodb_opcounters_query{instance=“localhost:9216”, job=“mongodb_exporter”}
- mongodb_opcounters_update{instance=“localhost:9216”, job=“mongodb_exporter”}
看起来,是各类操作的数量统计,比如 insert、query、update、delete 等,区分了 Repl 和非 Repl 的。这个概念现在我还不太懂,应该是副本集相关的,后面再持续研究。
document 相关
{__name__=~"mongodb_metrics_document_.*"}
得到如下结果:
- mongodb_metrics_document_deleted{instance=“localhost:9216”, job=“mongodb_exporter”}
- mongodb_metrics_document_inserted{instance=“localhost:9216”, job=“mongodb_exporter”}
- mongodb_metrics_document_returned{instance=“localhost:9216”, job=“mongodb_exporter”}
- mongodb_metrics_document_updated{instance=“localhost:9216”, job=“mongodb_exporter”}
这个是文档相关的统计,比如删除、插入、返回、更新等。
但是这样搞起来太费劲了。我决定换个采集器。
使用 Cprobe 采集 MongoDB 指标
Cprobe 也是一个常用的采集器,项目发起人是 UlricQin,目标是把各类常用的 Exporter 整合在一起,里边已经包含了 MongoDB 的采集能力,而且,也提供了 MongoDB 的 Grafana 仪表盘。
本文使用 Cprobe 的核心原因不是 MongoDB Exporter 不能采集,而是为了获得更匹配的指标命名和仪表盘模板。监控实践里经常会遇到这个问题:数据已经进来了,但仪表盘依赖的指标名、标签或版本不一致,最终仍然看不到图。
从 Cprobe 的 releases 页面下载发布包,然后修改配置文件,总共修改 3 个地方:
首先是 conf.d 下面的 writer.yaml,这里要配置监控数据采集了之后推给哪个 TSDB,即 Prometheus 的 remote write 地址,当然,只要是支持 remote write 协议的 TSDB 都可以。下面是我的配置内容:
global:
  extra_labels:
    colld: cprobe

writers:
- url: http://127.0.0.1:9090/api/v1/write
然后是 conf.d 下面的 main.yaml 和 rule.toml,main.yaml 类似 Prometheus 的抓取配置,要配置目标的 MongoDB 地址,我的配置如下:
global:
  scrape_interval: 15s
  external_labels:
    cplugin: 'mongodb'

scrape_configs:
- job_name: 'standalone'
  static_configs:
  - targets:
    - 127.0.0.1:27017
  scrape_rule_files:
  - 'rule.toml'
上例是采集 127.0.0.1:27017 这个 MongoDB 实例,上例中没有给出用户名和密码,实际是在 rule.toml 中配置的,main.yaml 会引用 rule.toml,rule.toml 的内容如下:
user = "exporteruser"
password = "MhxzKhl"

# SetDirect specifies whether or not a direct connect should be made.
# If set to true, the driver will only connect to the host provided
# in the URI and will not discover other hosts in the cluster.
# Direct connections are not valid if multiple hosts are specified or
# an SRV URI is used.
direct_connect = true

# Connection timeout
connect_timeout = "5s"

# to get $collStats
# e.g. ["db1.col1", "db2.col2"]
collstats_colls = []

# to get $indexStats
# e.g. ["db1.col1", "db2.col2"]
indexstats_colls = []

# Enable collecting metrics from getDiagnosticData
collect_diagnosticdata = true

# Enable collecting metrics from replSetGetStatus
collect_replicasetstatus = true

# Enable collecting metrics from dbStats
collect_dbstats = true

# Enable collecting free space metrics from dbStats
collect_dbstatsfreestorage = true

# Enable collecting metrics from top admin command
collect_topmetrics = true

# Enable collecting metrics currentop admin command
collect_currentopmetrics = true

# Enable collecting metrics from $indexStats
collect_indexstats = true

# Enable collecting metrics from $collStats
collect_collstats = true

# Enable collecting metrics from profile
collect_profile = true

# Set time window for scrape slow queries.
collect_profile_slowqueries_time_window_seconds = 30

# Enable descending index name override to replace -1 with _DESC
metrics_override_descending_index = false

# Disable collstats, dbstats, topmetrics and indexstats collector if there are more than <n> collections. 0=No limit
disable_collstats_if_collcount_more_than = 0

# Enable autodiscover collections
discovering_mode = true

# Enable old mongodb-exporter compatible metrics
compatible_mode = true
相比默认配置,我只是改了用户名和密码。
然后就可以启动 Cprobe 采集数据了,先做个测试:
./cprobe -no-writer -plugins mongodb
上面的命令可以看到输出了很多指标,就说明采集正常。然后再启动 Cprobe,这次启动的时候不加 -no-writer 参数,这样就会把采集到的数据推送到 Prometheus 了。
./cprobe -plugins mongodb
上面我仅仅是测试,所以直接前台启动了,实际生产环境中,可以使用 systemd 等工具来管理。
由于 Cprobe 是通过 remote write 推数据给 Prometheus,需要在 Prometheus 启动的时候 enable remote write receiver,比如我的 Prometheus 的启动命令:
./prometheus --config.file prometheus.9090.yml --storage.tsdb.path=./data9090 --web.enable-lifecycle --query.lookback-delta=1m --web.listen-address="0.0.0.0:9090" --web.enable-remote-write-receiver其中--web.enable-remote-write-receiver就是启用 remote write receiver。当然,不同版本的 Prometheus 参数可能有所不同,你可以通过./prometheus --help|grep remote-write来查看。
Ok,现在可以导入 Cprobe 提供的 Grafana 仪表盘了:https://github.com/cprobe/cprobe/blob/main/conf.d/mongodb/doc/dash/grafana_mongodb_01.json
导入之后,就可以看到 MongoDB 的监控数据了:
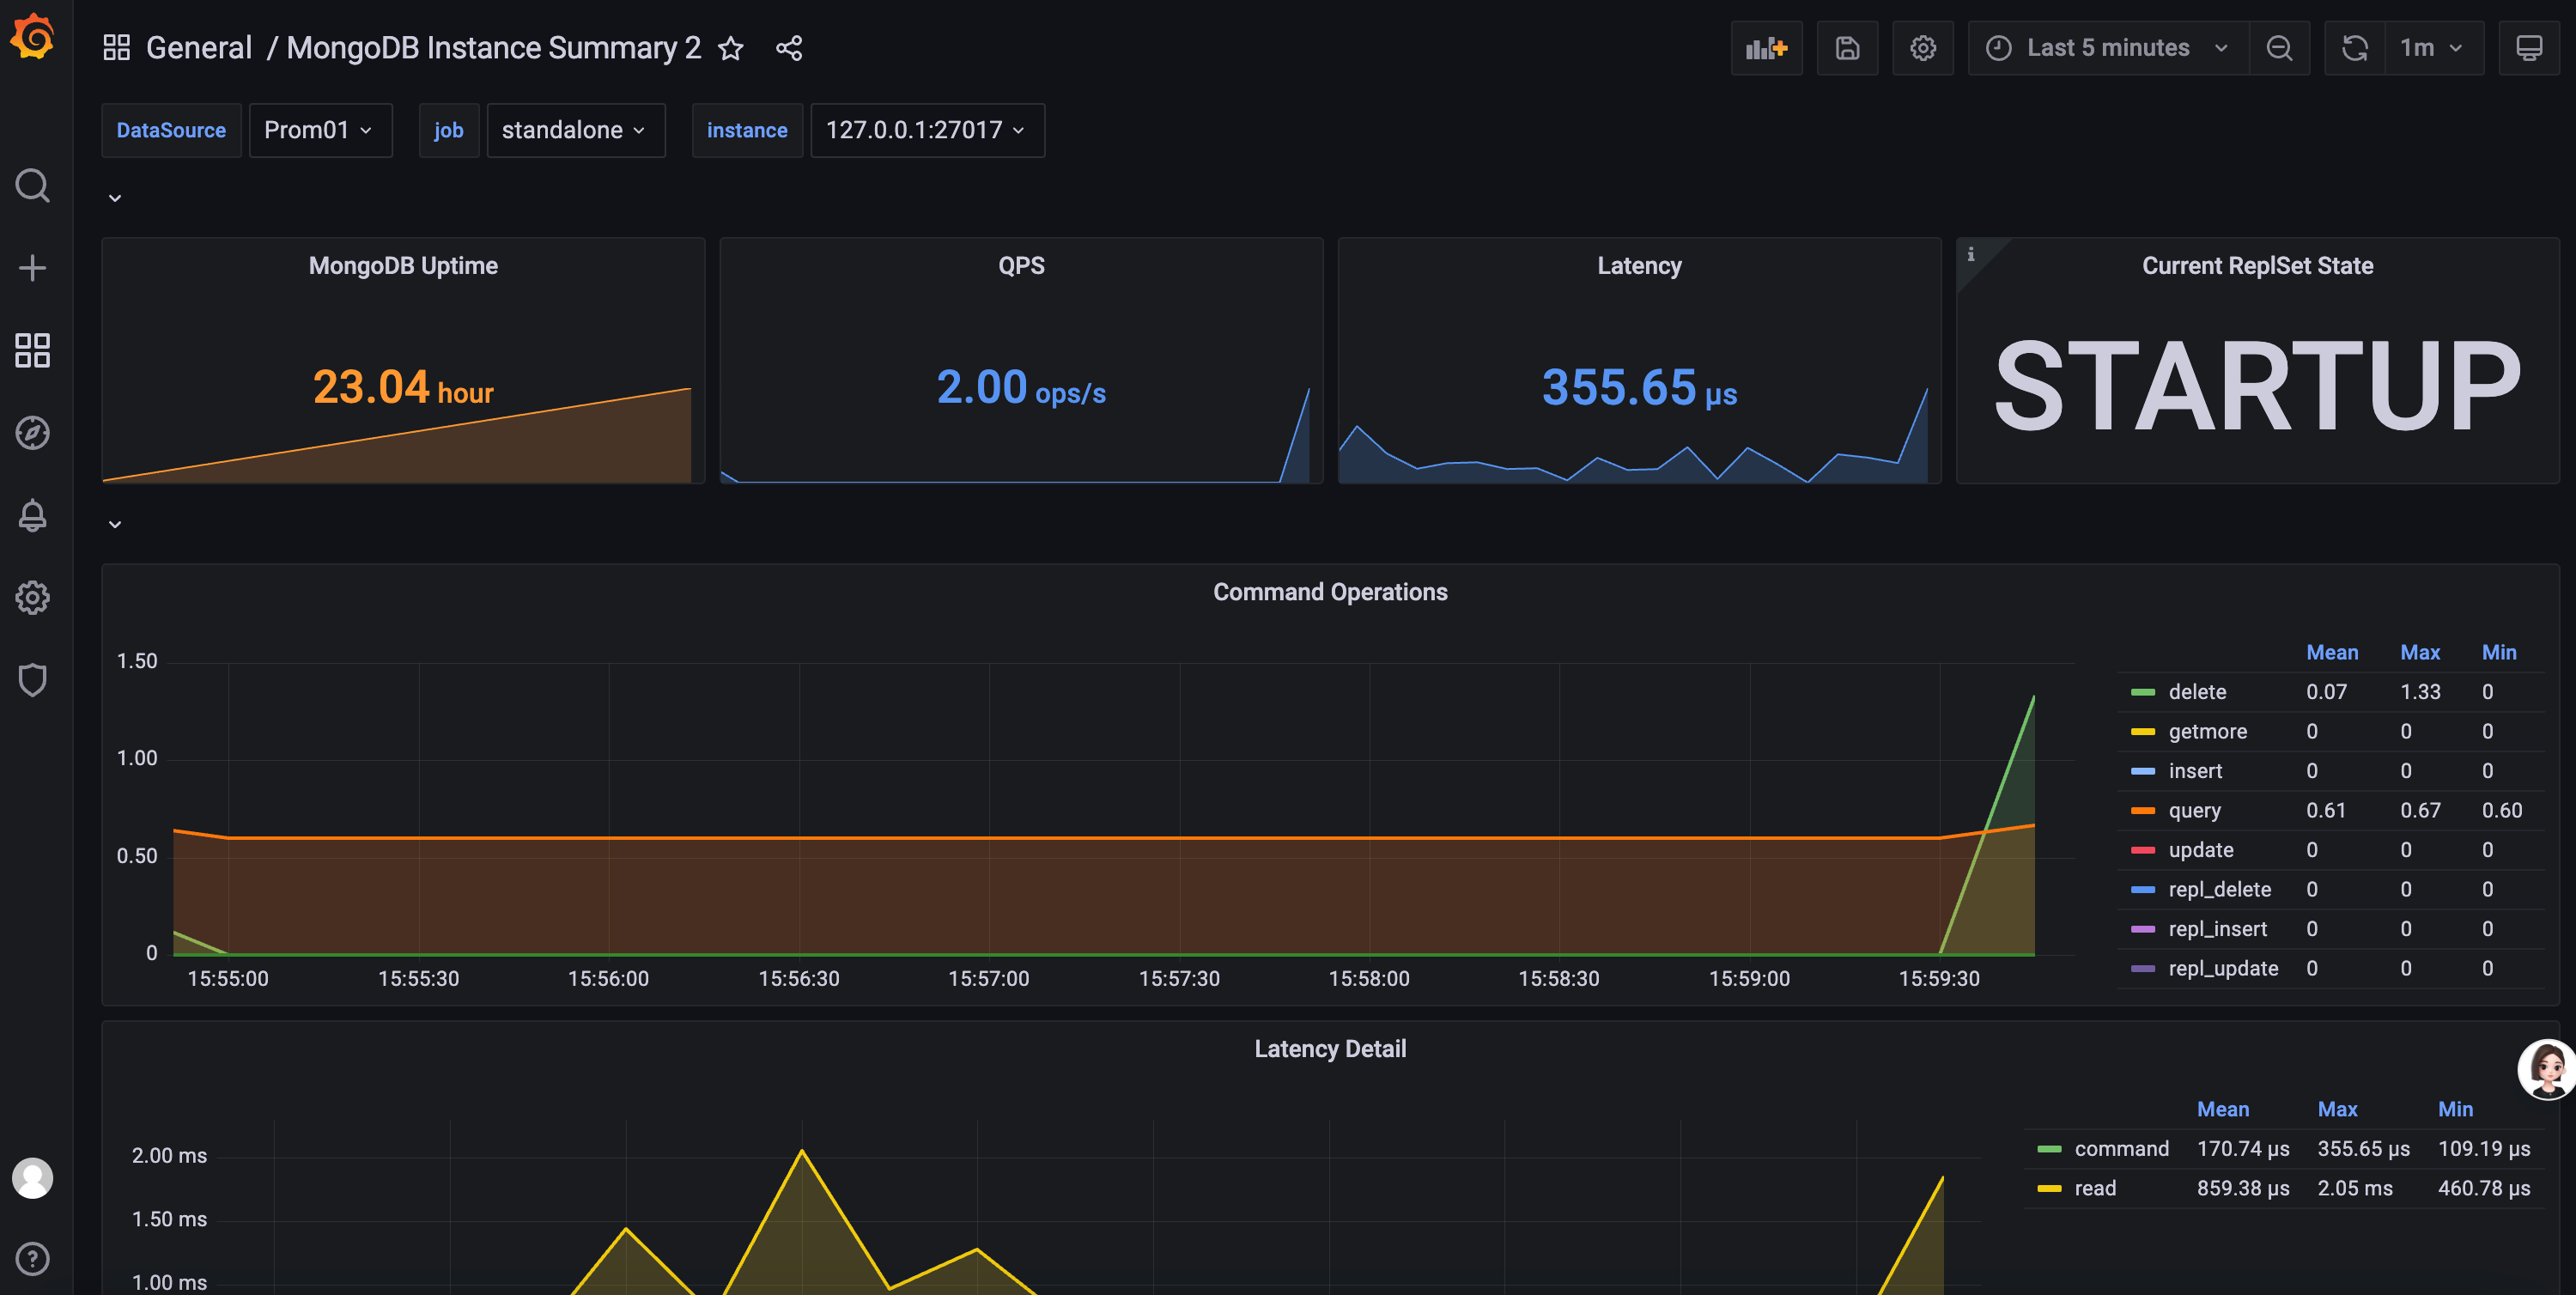
对于很多朋友,仪表盘都出来了,就完活了。实际上不懂图上的指标,后面排查问题也没有卵用。后面我们再找时间看看各个指标的含义,这样才能更好地排查问题。
总结
本文介绍了如何使用 Prometheus 抓取 MongoDB Exporter 数据,并尝试用 Grafana 渲染。由于指标命名和仪表盘模板不匹配,实际展示不够完整,所以继续使用 Cprobe 采集 MongoDB 监控数据,并导入 Cprobe 提供的 Grafana 仪表盘。
这篇文章的关键收获是:监控链路跑通只是第一步,仪表盘能展示也只是第二步。真正用于排障时,还需要理解图上的指标含义。下一篇文章,我们将继续研究 MongoDB 的监控指标和展示方式。
FAQ
Q1:Prometheus Targets 里 MongoDB Exporter 显示 UP 代表什么?
A:代表 Prometheus 能够访问 Exporter 的抓取端点,不代表所有 MongoDB 关键指标和 Grafana 仪表盘都已经完全匹配。
Q2:为什么 Grafana 仪表盘导入后可能没有数据?
A:常见原因是仪表盘使用的指标名或标签和当前采集器版本不一致。本文遇到的问题就是指标名字对不上。
Q3:为什么又尝试 Cprobe?
A:因为 Cprobe 已经包含 MongoDB 采集能力,并提供了对应的 Grafana 仪表盘,适合快速得到一套能展示的 MongoDB 监控视图。