
nginx_upstream_check_module 适合监控 Nginx upstream 后端节点的健康状态。相比只看 Nginx 进程或连接数,它能回答更具体的问题:哪个 upstream 后端是否可用、健康检查是否失败、节点状态是否发生变化。
本文以 CentOS 7.2 为测试环境,说明如何添加 nginx_upstream_check_module、配置 /upstream_status 状态页,并用 Categraf input.nginx_upstream_check 插件采集 upstream 指标。因为 Nginx 添加第三方模块通常需要重新编译,建议先在测试环境完成验证,再安排生产变更。
核心要点
- 该方案依赖第三方模块
nginx_upstream_check_module,需要下载源码、应用对应版本 patch,并在./configure中通过--add-module引入。 - Nginx 侧通过
check、check_http_send、check_http_expect_alive配置 upstream 健康检查。 - 状态页通过
check_status暴露,Categraf 访问?format=json后采集 upstream 健康状态指标。 - 本文示例中的 IP、端口、Nginx 版本和模块目录需要按实际环境替换。
测试环境
- 操作系统: CentOS 7.2
安装依赖
这些依赖是我这个环境下的, 你可以根据自己的环境安装对应的依赖。
yum install -y patch
yum install -y gd gd-devel
yum install -y libxslt-devel
yum install perl-ExtUtils-Embed
第三方依赖
下载第三方依赖,并解压到目录/etc/nginx/third-modules/下。
https://github.com/yaoweibin/nginx_upstream_check_module
下载nginx源码
wget http://nginx.org/download/nginx-1.20.2.tar.gz
tar zxvf nginx1.20.2.tar.gz
cd nginx-1.20.2
# 注意,要记得打下对应版本的patch
patch -p1 -i /etc/nginx/third-modules/nginx_upstream_check_module/check_1.20.1+.patch
编译nginx
感谢@Jeff的细心整理。
./configure \
--with-ld-opt="-Wl,-rpath,/usr/local/lib" \
--prefix=/usr/share/nginx \
--sbin-path=/usr/sbin/nginx \
--modules-path=/usr/lib64/nginx/modules \
--conf-path=/etc/nginx/nginx.conf \
--error-log-path=/var/log/nginx/error.log \
--http-log-path=/var/log/nginx/access.log \
--http-client-body-temp-path=/var/lib/nginx/tmp/client_body \
--http-proxy-temp-path=/var/lib/nginx/tmp/proxy \
--http-fastcgi-temp-path=/var/lib/nginx/tmp/fastcgi \
--http-uwsgi-temp-path=/var/lib/nginx/tmp/uwsgi \
--http-scgi-temp-path=/var/lib/nginx/tmp/scgi \
--pid-path=/var/run/nginx.pid \
--lock-path=/run/lock/subsys/nginx \
--user=nginx \
--group=nginx \
--with-compat \
--with-threads \
--with-http_addition_module \
--with-http_auth_request_module \
--with-http_dav_module \
--with-http_flv_module \
--with-http_gunzip_module \
--with-http_gzip_static_module \
--with-http_mp4_module \
--with-http_random_index_module \
--with-http_realip_module \
--with-http_secure_link_module \
--with-http_slice_module \
--with-http_ssl_module \
--with-http_stub_status_module \
--with-http_sub_module \
--with-http_v2_module \
--with-mail \
--with-mail_ssl_module \
--with-stream \
--with-stream_realip_module \
--with-stream_ssl_module \
--with-stream_ssl_preread_module \
--with-select_module \
--with-poll_module \
--with-file-aio \
--with-http_xslt_module=dynamic \
--with-http_image_filter_module=dynamic \
--with-http_perl_module=dynamic \
--with-stream=dynamic \
--with-mail=dynamic \
--with-http_xslt_module=dynamic \
--add-module=/etc/nginx/third-modules/nginx_upstream_check_module
验证
至此 编译完成,输入nginx -V查看编译参数,如果有以下参数则表示编译成功。
--add-module=/etc/nginx/third-modules/nginx_upstream_check_module
upstream check配置
进入 /etc/nginx,编辑 nginx.conf 输入以下内容。主配置保持简洁,具体 upstream、健康检查和状态页配置放到 conf.d 下。
user  nginx;
worker_processes  1;

events {
    worker_connections  1024;
}

http {
    include       mime.types;
    default_type  application/octet-stream;

    sendfile        on;

    keepalive_timeout  65;
    include conf.d/*.conf;
}
创建 conf.d 目录,编辑一个 test.conf 输入以下内容。
upstream test {
    server 127.0.0.1:18788 weight=10 max_fails=2 fail_timeout=5s;
    check interval=3000 rise=2 fall=5 timeout=1000 type=http;
    check_http_send "GET / HTTP/1.0\r\n\r\n";
    check_http_expect_alive http_2xx http_3xx http_4xx http_5xx;
}

server {
        listen 80;
        server_name 192.168.11.201;

		location /upstream_status {
			check_status;
    		access_log   off;
		}
		location / {
                        add_header Content-Type text/plain;
                        return 200 "User-agent: *\nDisallow: /\n";
		}

		location /test {
            proxy_pass_header Authorization;
            proxy_pass_header Accept;
            proxy_set_header X-Real-IP $remote_addr;
            proxy_set_header X-Forwarded-For $proxy_add_x_forwarded_for;
            proxy_set_header X-Forwarded-Proto $scheme;
            proxy_set_header X-Scheme $scheme;
            proxy_set_header Authorization $http_authorization;
            proxy_set_header Accept $http_accept;
            proxy_pass http://test;
		}
}
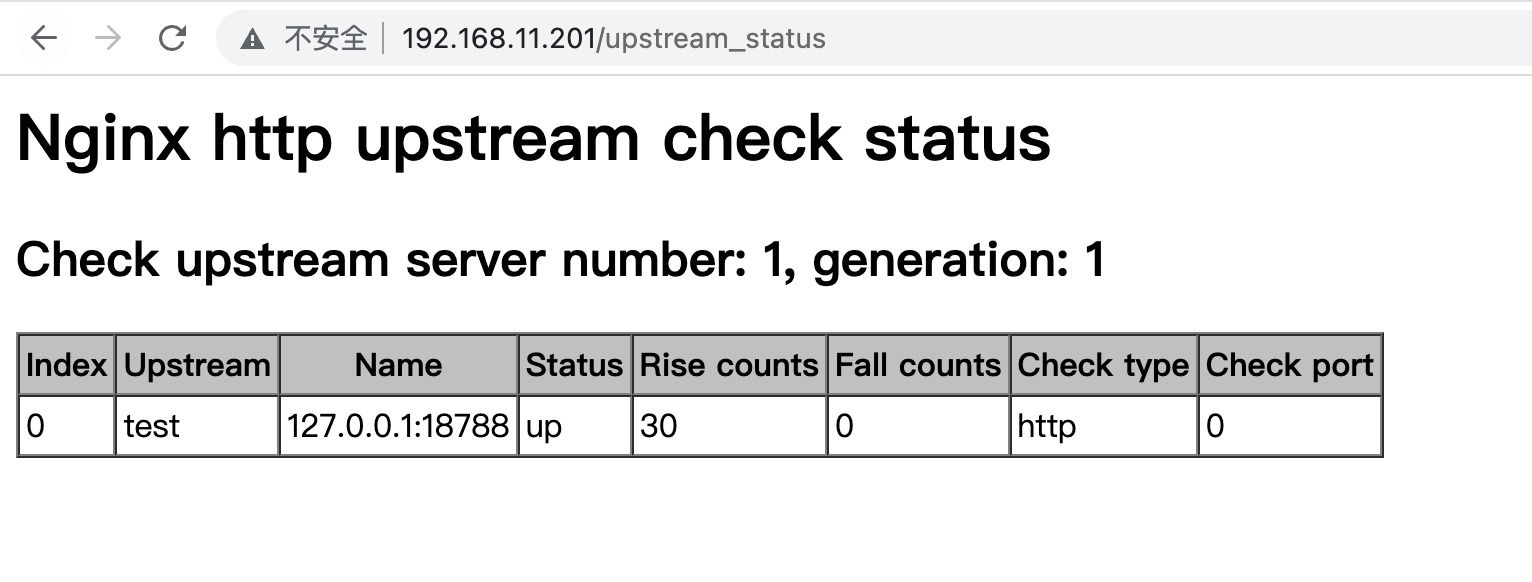
这段配置里,check interval=3000 rise=2 fall=5 timeout=1000 type=http; 是健康检查核心参数:按固定间隔探测后端,连续成功或失败达到阈值后更新节点状态。/upstream_status 暴露检查结果,后续采集器从这个入口读取 JSON 数据。
启动nginx
  nginx -t # 检查配置文件
  nginx #启动nginx
访问 http://192.168.11.201/upstream_status 查看状态
categraf input.nginx_upstream_check插件
配置 conf/input.nginx_upstream_check/nginx.toml 内容如下
[[instances]]
targets = [
    "http://192.168.11.201/upstream_status?format=json",
]
启动 Categraf 测试,可以看到已经采集到指标。

采集结果包含 upstream 的 rise、down 等指标,适合用于后端节点健康状态监控。
| 监控对象 | 典型指标含义 | 适合回答的问题 |
|---|---|---|
| upstream 节点状态 | 节点 up/down、rise、fall | 后端节点是否健康,是否反复抖动 |
| 健康检查结果 | HTTP 探测成功或失败 | Nginx 到后端服务的探测链路是否正常 |
| 状态页可用性 | /upstream_status?format=json 是否可采集 |
模块是否加载成功,采集路径是否可用 |
如果只需要 Nginx 基础连接数,可以使用 stub_status;如果重点关注后端节点健康检查,本文的 upstream check 方案更直接。
大盘链接
根据指标整理的监控大盘见 https://github.com/flashcatcloud/categraf/blob/main/inputs/nginx_upstream_check/dashboards.json
常见问题
Q1:为什么 patch 会失败?
A:通常是 Nginx 源码版本和模块 patch 版本不匹配。本文示例使用 nginx-1.20.2,并提示使用 check_1.20.1+.patch,实际环境要选择与源码版本对应的 patch。
Q2:为什么 Categraf 要访问 ?format=json?
A:input.nginx_upstream_check 需要结构化状态数据,?format=json 便于插件解析 upstream 和后端节点状态。
Q3:这个方案能替代业务探活吗? A:不能完全替代。它能反映 Nginx 到 upstream 后端的健康检查结果,但业务完整链路仍需要结合应用指标、日志、链路追踪或主动拨测。
小结
Nginx upstream 采集的关键是先让 Nginx 自己具备 upstream 健康检查能力,再通过状态页把结果暴露给 Categraf。完成后,可以围绕后端节点 up/down、rise/fall 和健康检查状态建设告警,及时发现 upstream 节点异常。
关于作者
本文作者孔飞,快猫星云工程师,文章内容是快猫技术团队共同沉淀的结晶。我们会持续输出监控、稳定性保障相关的技术文章,文章可转载,转载请注明出处,尊重技术人员的成果。