
在本文中,我将解释我如何分析和配置我的 Prometheus 以显著减少其资源使用并解决基数问题。这是上一篇文章《Prometheus 瘦身第一步,使用 mimirtool 找到没用的 Prometheus 指标》的后续。
核心摘要
- Prometheus 性能优化没有万能开关,核心是先识别哪些指标没用、哪些指标基数高、哪些标签导致 series 暴涨。
- 最优先的治理位置是源头:能在 Exporter 侧关闭 collector,就不要等指标进入 Prometheus 后再 drop。
- 对少量无法在 Exporter 侧关闭的指标,可以使用
metricRelabelings在 scrape 之后、ingest 之前丢弃。 - 高基数治理应优先关注 series 数量最多的指标,而不是机械删除所有未使用指标。
- Prometheus UI 的
/tsdb-status、Cardinality Explorer dashboard 和 pprof 可以分别用于基数排查、标签维度分析和资源占用分析。 - 所有优化都依赖具体环境、指标使用情况和规模,不能把示例规则照搬为最终生产配置。
先决条件
本文中描述的所有内容都是在 Kubernetes 环境中使用 kube-prometheus-stack 完成的。如果您的设置不同,您可能需要进行调整。
我还假设您有已使用和未使用指标的列表,如果还没有,请在我之前的文章中了解如何执行此操作。如果您想使用示例数据,可以使用 dotdc/prometheus-cardinality 代码仓库。
简介
Prometheus 项目试图让事情尽可能简单。它也非常开放,一些特定场景的功能通常被转嫁到其他项目,如 Thanos、Mimir 或 VictoriaMetrics。出于这个原因,没有魔法标志可以显著改变 Prometheus 的行为。
为了提高 Prometheus 的性能,您需要了解自己的使用情况,并根据用例和规模做出设计选择。现在我们知道哪些指标被使用、哪些指标未使用,接下来就看如何配置 Prometheus。
丢弃不用的指标
最容易想到的显然是丢弃未使用的指标。这里的“未使用”来自前置分析,而不是凭感觉删除。以下是我们可以丢弃的未使用列表中的一些指标:
node_arp_entries
node_netstat_Udp6_OutDatagrams
node_netstat_Udp6_RcvbufErrors
node_sockstat_FRAG6_inuse
node_sockstat_RAW6_inuse
node_softnet_dropped_total
node_softnet_processed_total
[...]
有几种方法可以丢弃指标,让我们梳理一下最常见的方法。
配置 Exporter
配置数据源,比如机器监控,大多数情况下我们会使用 node-exporter。合理配置 Exporter 可以节省大量时间和资源,因为这是控制指标规模的源头:指标没有产生,就不会被抓取、传输、写入和查询。
我们可以做的第一件事是检查采集器有哪些参数可供选择,node_exporter 具有打开和关闭的 collector 的功能。
prometheus-node-exporter:
  # Doc: https://github.com/prometheus/node_exporter#collectors
  extraArgs:
    # Disable unused collectors
    - --no-collector.arp
    - --no-collector.ipvs
    - --no-collector.sockstat
    - --no-collector.softnet
    # Excludes from kube-prometheus-stack
    - --collector.filesystem.mount-points-exclude=^/(dev|proc|sys|var/lib/docker/.+|var/lib/kubelet/.+)($|/)
    - --collector.filesystem.fs-types-exclude=^(autofs|binfmt_misc|bpf|cgroup2?|configfs|debugfs|devpts|devtmpfs|fusectl|hugetlbfs|iso9660|mqueue|nsfs|overlay|proc|procfs|pstore|rpc_pipefs|securityfs|selinuxfs|squashfs|sysfs|tracefs)$
如上,我们禁用了 arp, ipvs, sockstat 和 softnet 等采集器。如果不想禁用整个 collector,有些 collector 支持配置一些额外的包含、排除规则。
以下是撰写本文时的清单:
# Exclude flags
--collector.arp.device-exclude
--collector.diskstats.device-exclude
--collector.ethtool.device-exclude
--collector.filesystem.fs-types-exclude
--collector.filesystem.mount-points-exclude
--collector.netdev.device-exclude
--collector.qdisk.device-exclude
--collector.systemd.unit-exclude

# Include flags
--collector.arp.device-include
--collector.cpu.info.bugs-include
--collector.cpu.info.flags-include
--collector.diskstats.device-include
--collector.ethtool.metrics-include
--collector.netdev.device-include
--collector.qdisk.device-include
--collector.sysctl.include
--collector.systemd.unit-include
使用 relabel 规则
现在,假设我们想 drop 少量指标,而这些指标对应的 collector 又不支持配置排除规则。既然不能通过 Exporter 来做到,那就只能通过 relabel 规则来 drop 了。这些规则发生在 scrape 之后,但是在 ingest 之前(译者注:抓取到了,但是还没有往后端写)。
解释 relabel 的工作原理不在本文的范围内,但如果您想了解更多信息,Grafana 有一篇关于此的优秀文章:Prometheus 中的 relabel 如何工作。
下面是一个 drop 规则:
- sourceLabels: [__name__]
  action: drop
  regex: 'node_(nf_conntrack_stat|netstat_.*6|timex_pps|network_carrie|network_iface|scrape).*'
此规则需要添加到您的 Prometheus 设置中,在我的例子中,我将它添加到我的 kube-prometheus-stack values 中的 node_exporter ServiceMonitor。
下面是针对 node-exporter 相关的 kube-prometheus-stack values:
# kube-prometheus-stack values for node-exporter metrics

prometheus-node-exporter:
  # Doc: https://github.com/prometheus/node_exporter#collectors
  extraArgs:
    # Disable unused collectors
    - --no-collector.arp
    - --no-collector.ipvs
    - --no-collector.sockstat
    - --no-collector.softnet
    # Excludes from kube-prometheus-stack
    - --collector.filesystem.mount-points-exclude=^/(dev|proc|sys|var/lib/docker/.+|var/lib/kubelet/.+)($|/)
    - --collector.filesystem.fs-types-exclude=^(autofs|binfmt_misc|bpf|cgroup2?|configfs|debugfs|devpts|devtmpfs|fusectl|hugetlbfs|iso9660|mqueue|nsfs|overlay|proc|procfs|pstore|rpc_pipefs|securityfs|selinuxfs|squashfs|sysfs|tracefs)$

  prometheus:
    monitor:
      enabled: true

      # MetricRelabelConfigs to apply to samples after scraping, but before ingestion.
      # Doc: https://github.com/prometheus-operator/prometheus-operator/blob/main/Documentation/api.md#relabelconfig
      metricRelabelings:
        # Unused node-exporter metrics
        - sourceLabels: [__name__]
          action: drop
          regex: 'node_(nf_conntrack_stat|netstat_.*6|timex_pps|network_carrie|network_iface|scrape).*'
跟踪指标基数问题
你现在可以 disable 或者 drop 指标了,具体使用哪种方式取决于自己的场景。删除每个未使用的指标可能很耗时,甚至会适得其反,因为重新标记规则会消耗 Prometheus 实例上的大量资源。
相比 drop 所有指标,更应该优先关注高基数指标。高基数指标会显著增加 series 数量,进而影响内存、查询和存储压力。
找到高基数的指标
使用 Prometheus UI
Prometheus UI 已经具有开箱即用的基数信息。
让我们做一个端口转发来在本地公开我们的 Prometheus 实例:
# kubectl get po -n monitoring | grep prometheus
my_prometheus_pod="prometheus-kube-prometheus-stack-prometheus-0"

# port-forward
kubectl port-forward ${my_prometheus_pod} -n monitoring 9090:9090
完成后,您应该能够在浏览器中打开 http://localhost:9090/tsdb-status。
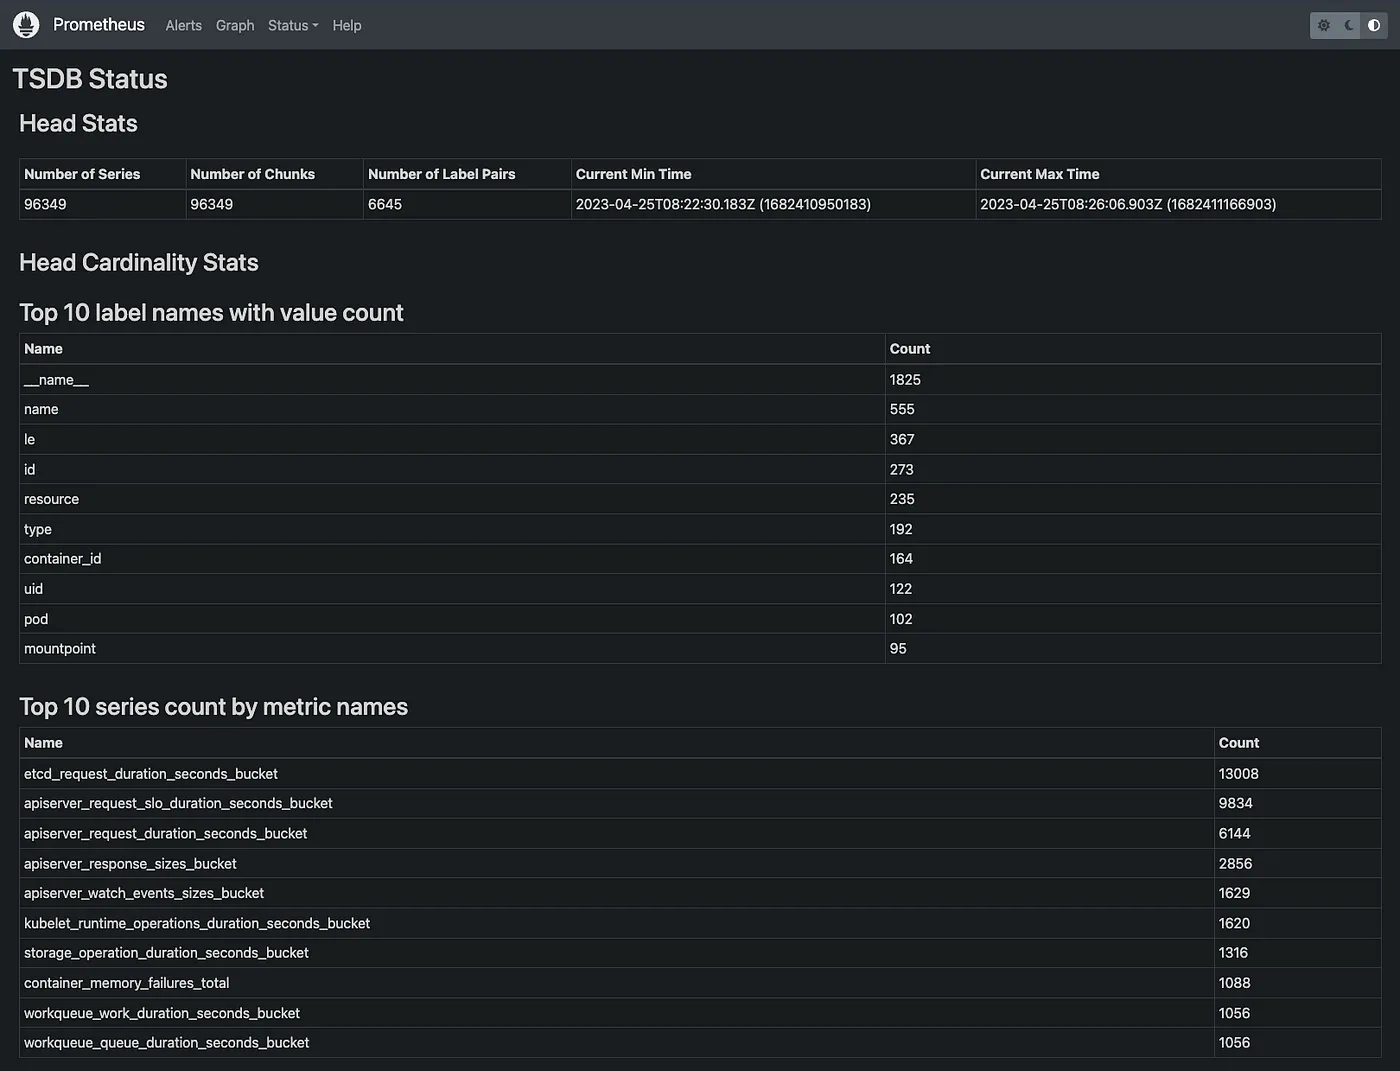
Screenshot: Prometheus Web UI.
从这里,您将获得一堆有用的统计数据来开始高基数调查:
- value最多的前10个标签名称
- 指标最多的前10个指标名称
- 占用内存最多的前10大标签名称
- 指标最多的前10个标签对
首先,你应该关注“指标最多的前10个指标名称”。你也可以使用下面的 PromQL 获取此信息。你可以随意调整 PromQL 来查看更多指标,下面这个 PromQL 是查看了前 20 个:
topk(20, count by (__name__)({__name__=~".+"}))
我们的前 10 名看起来像这样:
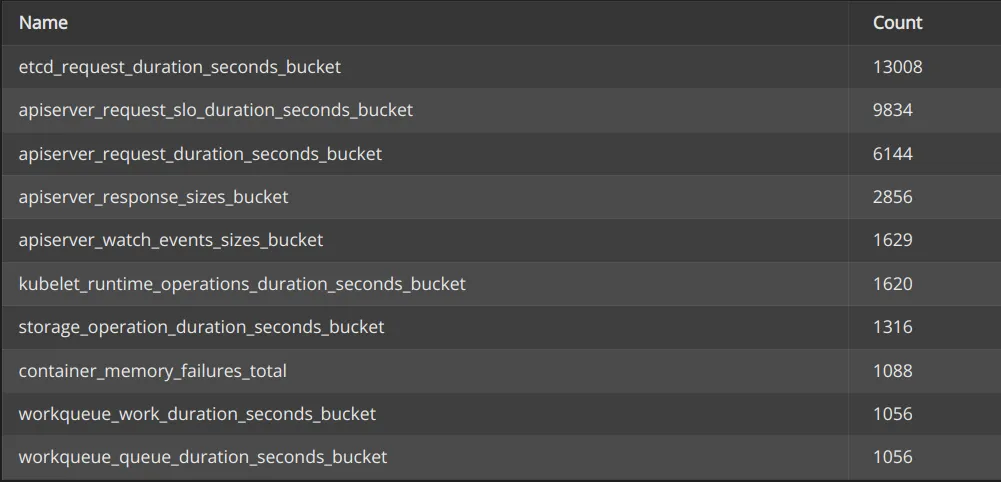
Screenshot: Top 10 series count by metric names
让我们将第一个与我们导出的已使用和未使用指标列表进行比较:
$ grep etcd_request_duration_seconds_bucket u*_metrics.txt
unused_metrics.txt:etcd_request_duration_seconds_bucket
在此示例中,我们可以看到最大的 series etcd_request_duration_seconds_bucket 未在任何地方使用,因此可以删除它。无论是否使用这些指标,都强烈建议先分析再决定保留或丢弃。这会对 Prometheus 实例的性能产生重大影响。
使用基数浏览器
有时,您会有一些需要保留的高基数指标,但您仍然需要为基数问题找到解决方案。有一个出色的仪表板可以查找和了解 Prometheus 指标的基数,即 Cardinality Explorer dashboard。您可以在 Grafana 上使用 ID 11304 导入它。
仪表板包含操作方法和常见问题解答部分,可帮助您理解和使用此仪表板。让我们使用仪表板分析 etcd_request_duration_seconds_bucket 指标:
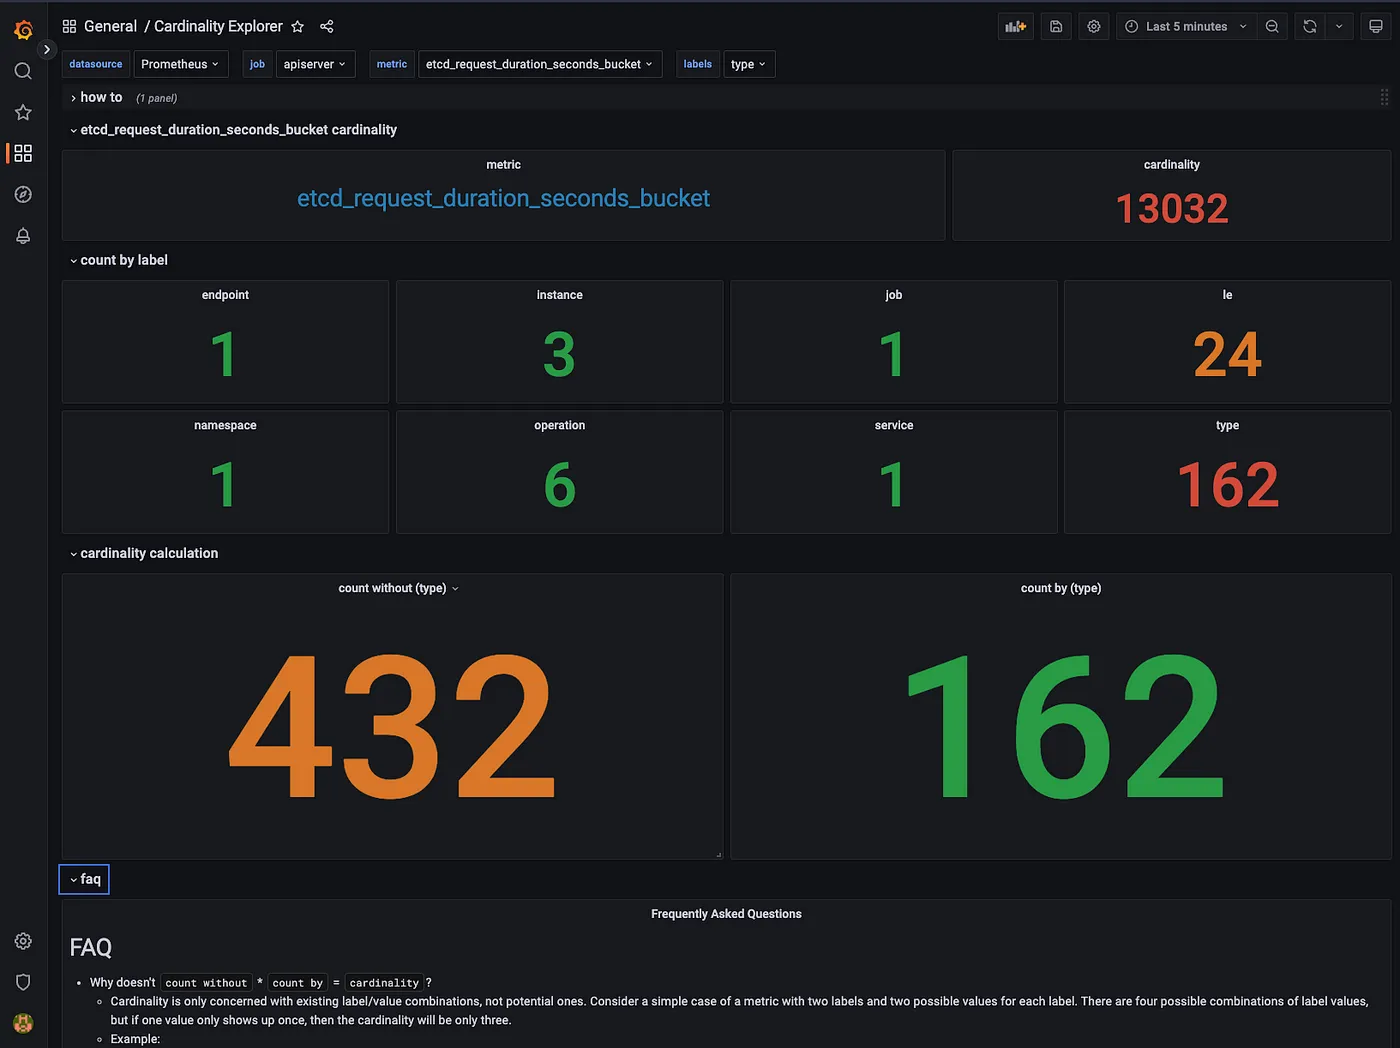
Screenshot: Cardinality Explorer dashboard with etcd_request_duration_seconds_bucket.
正如我们在这里看到的,type 标签有 162 个不同的值。此指标的基数为 13032,但如果没有 type 标签则仅为 432。
如您所见,此仪表板擅长在指标中查找标签维度。有了这些信息,您可以决定优化、删除或清空标签的最佳方式,甚至可以重新设计指标本身。请记住,删除标签会创建重复的系列,请确保指标在删除标签后仍然保持唯一标记。
更进一步
为您的 Prometheus 找到合适的设置后,您应该会注意到性能和资源使用方面的显著改进。根据您的目标和规模,您可能需要更进一步。
使用 pprof 分析资源占用
如果您想查看和了解 Prometheus 如何使用其 CPU 和内存资源,pprof 可能会为您提供很多附加信息。
安装 pprof 和 graphviz 后,您将能够以 svg 格式导出此数据:
# Export the cpu data
pprof -svg http://localhost:9090/debug/pprof/profile > pprof-prom-profile.svg
# Export the mem data
pprof -svg http://localhost:9090/debug/pprof/allocs > pprof-prom-allocs.svg
# Export the heap data
pprof -svg http://localhost:9090/debug/pprof/heap > pprof-prom-heap.svg
样例:
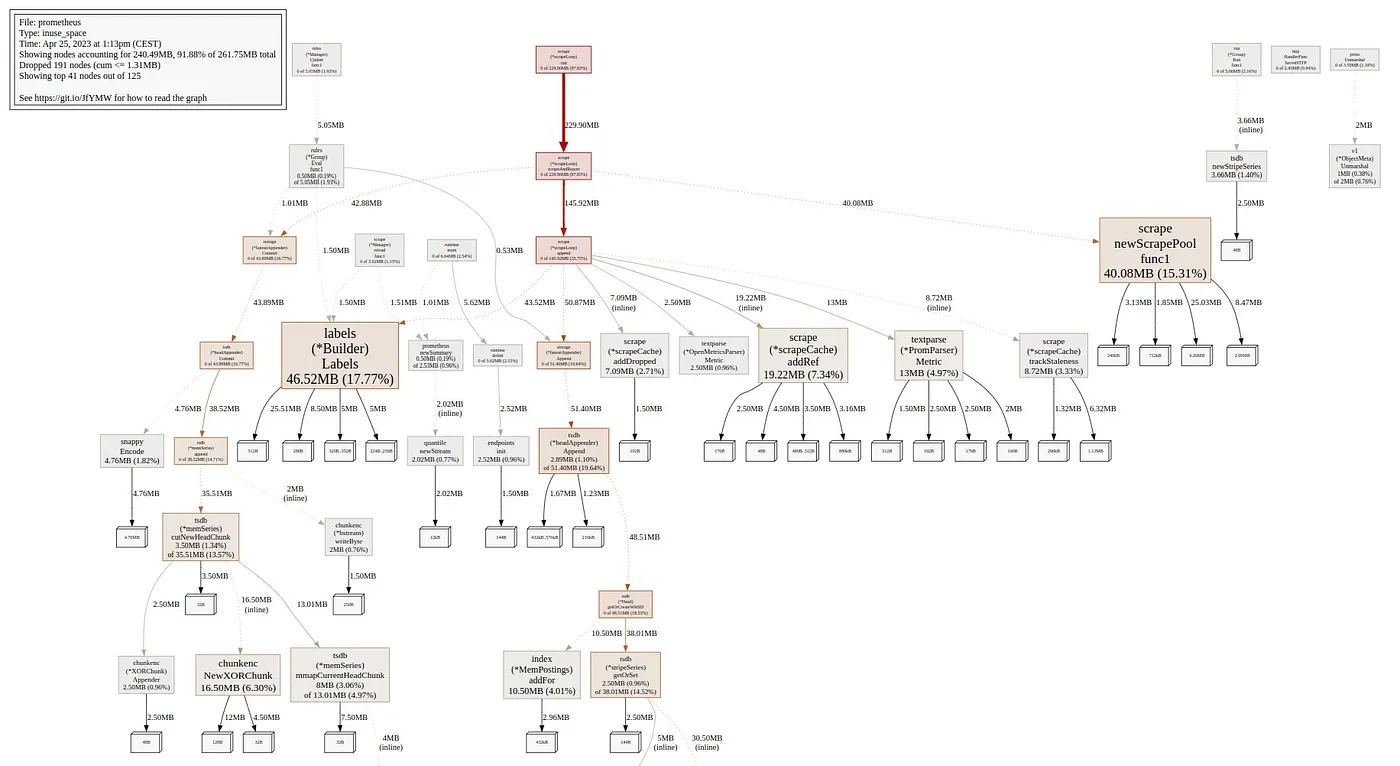
Screenshot: Prometheus heap visualization from pprof.
配置 scrapeInterval
根据用例为每个 target 或 ServiceMonitor 配置 scrape_interval 始终是一个好习惯。当您监控基础架构或应用程序性能时,通常需要较合适的采集频率;但某些用例没有这个要求,就应该相应放宽配置。
考虑替代方案
根据您的用例和规模,如果还没有,您可能需要考虑使用其他 Prometheus 兼容解决方案,如 Thanos、Mimir 或 VictoriaMetrics。
结论
这样做的结果将在很大程度上取决于您的初衷、环境以及对指标所做的选择。举个真实的例子,我在工作中这样做,能够将平均 CPU 使用率降低多达 119%,将平均内存使用率降低多达 139%,同时提高整体性能和稳定性。
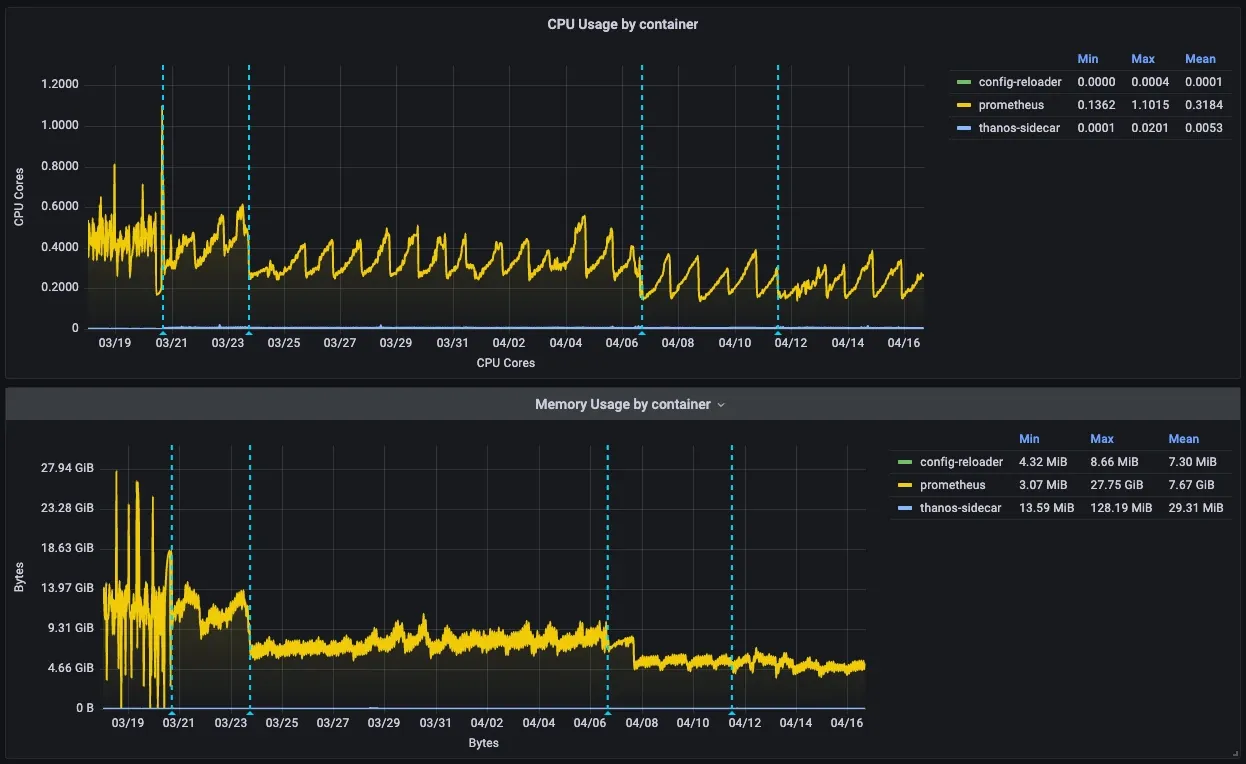
Screenshot: Evolution of resource usage while doing optimizations.
如果您计划在您的环境中做上述的事情,则应将精力集中在高基数指标上。我还推荐使用 k8s-views-pods.json 仪表板来跟踪您的 Prometheus 实例在此过程中的资源使用情况。
Useful tools:
Useful links:
- https://grafana.com/blog/2022/03/21/how-relabeling-in-prometheus-works/
- https://grafana.com/docs/grafana-cloud/billing-and-usage/control-prometheus-metrics-usage/usage-reduction/
- https://promlabs.com/blog/2022/12/15/understanding-duplicate-samples-and-out-of-order-timestamp-errors-in-prometheus/
结论
在本文中,我们了解了如何显著减少资源使用并解决 Prometheus 中的基数问题。在规模上,这会对性能产生巨大影响并降低平台的总体成本。我希望你觉得这篇文章有用!
FAQ
Q1:Prometheus 高基数问题应该先从哪里排查?
A:先看 series 数量最多的指标和标签维度。Prometheus UI 的 /tsdb-status 可以提供指标名称、标签名称、标签对等维度的排名。
Q2:为什么优先在 Exporter 侧关闭指标,而不是全部用 relabel drop?
A:Exporter 侧关闭指标可以从源头减少抓取、传输和写入成本;relabel drop 发生在 scrape 之后、ingest 之前,仍然会带来一定抓取和处理开销。
Q3:是否应该删除所有未使用指标?
A:不一定。逐个删除所有未使用指标可能耗时,也可能因为大量 relabel 规则增加 Prometheus 负担。更实用的策略是优先治理高基数指标。
Q4:删除标签能降低基数吗?
A:可能可以,但要谨慎。删除标签可能产生重复 series,必须确认删除后指标仍然唯一,否则会引入新的数据问题。
Q5:什么时候考虑 Thanos、Mimir 或 VictoriaMetrics?
A:当当前 Prometheus 的用例和规模已经超出单实例舒适区,或者需要更强的长期存储、水平扩展、查询或多租户能力时,可以评估这些兼容方案。
您可以通过如下方式关注我:
- GitHub : https://github.com/dotdc
- Mastodon : https://hachyderm.io/@0xDC
- Twitter : https://twitter.com/0xDC_
- LinkedIn : https://www.linkedin.com/in/0xDC
👋
告警风暴、告警漏报的烦恼
我们观察到很多公司都搭建了不止一套监控系统(Zabbix、Prometheus、Open-Falcon、Nightingale、云监控、Grafana),人员信息、告警事件散落在各个系统里,经常会遇到告警风暴、告警漏报的问题,我们提供 Flashduty 告警事件 OnCall 中心的产品,可以做到告警聚合降噪、排班、认领、升级、协同、和钉钉/飞书/企微丝滑打通,快来免费注册试用吧:https://console.flashcat.cloud/。