Nightingale Historical Alerts
Historical alerts display all past events, including alert events and recovery events. Each alert event is preceded by a color block: green represents a recovery event, while other colors represent alert events. The deeper the color, the higher the event level.
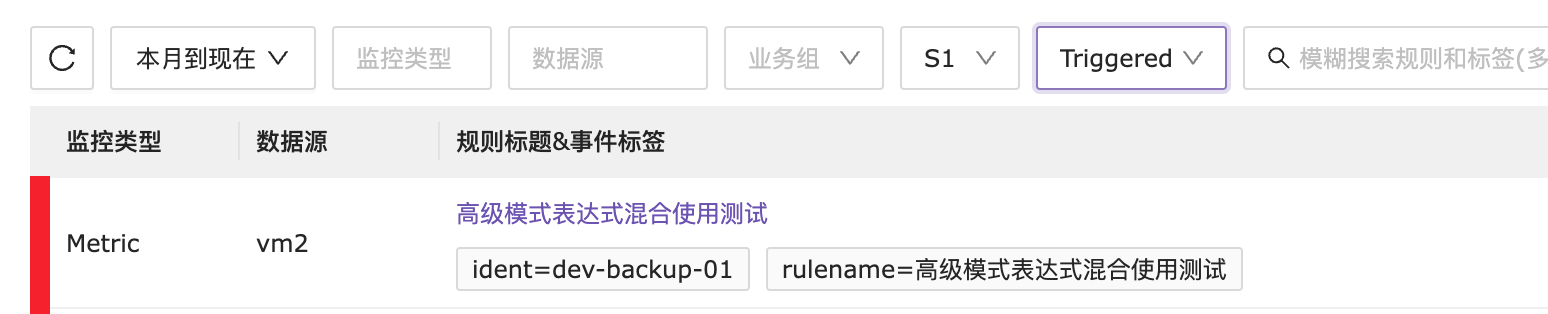
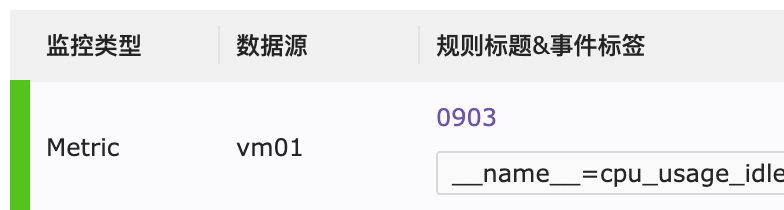
Level 1 Alert Example
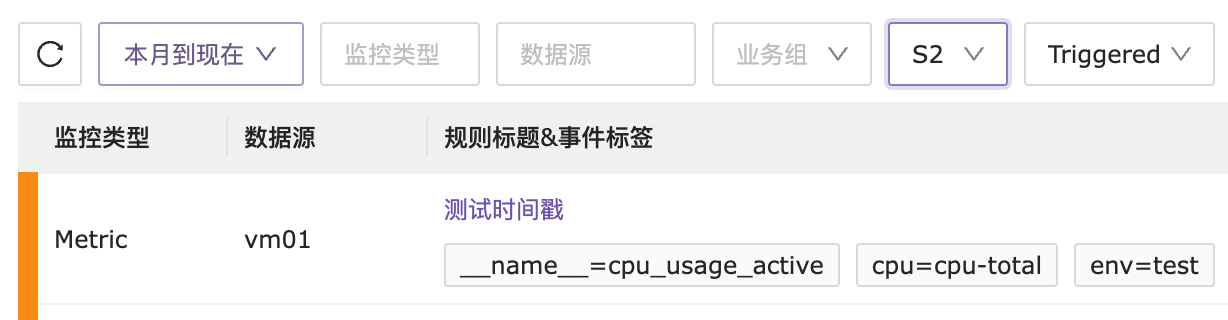
Level 2 Alert Example
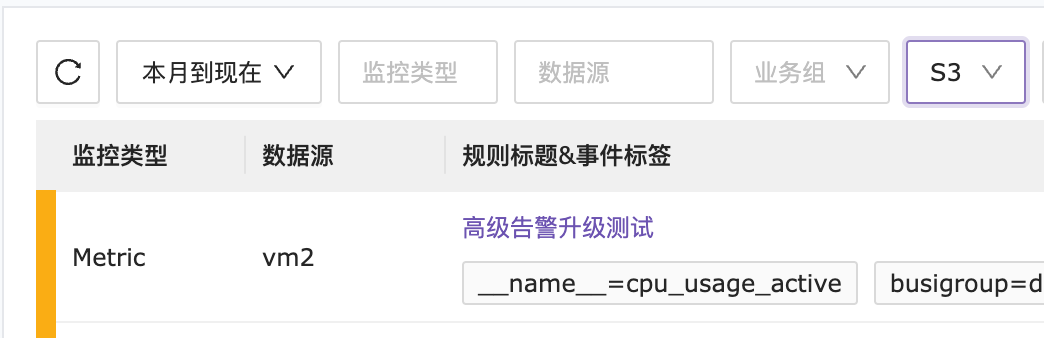
Level 3 Alert Example
Recovery Alert Example
Historical Alert Table Header Explanation
The first row contains the alert event filtering conditions. Select the required filter criteria according to your needs. The search box also supports specific condition searches, and the filtered alert events can be exported as a CSV table.

Example of Exporting Table
Set the filter condition for the past 7 days with IP = 192.168.10.110 for Level 1 alerts, then click the export button on the right.
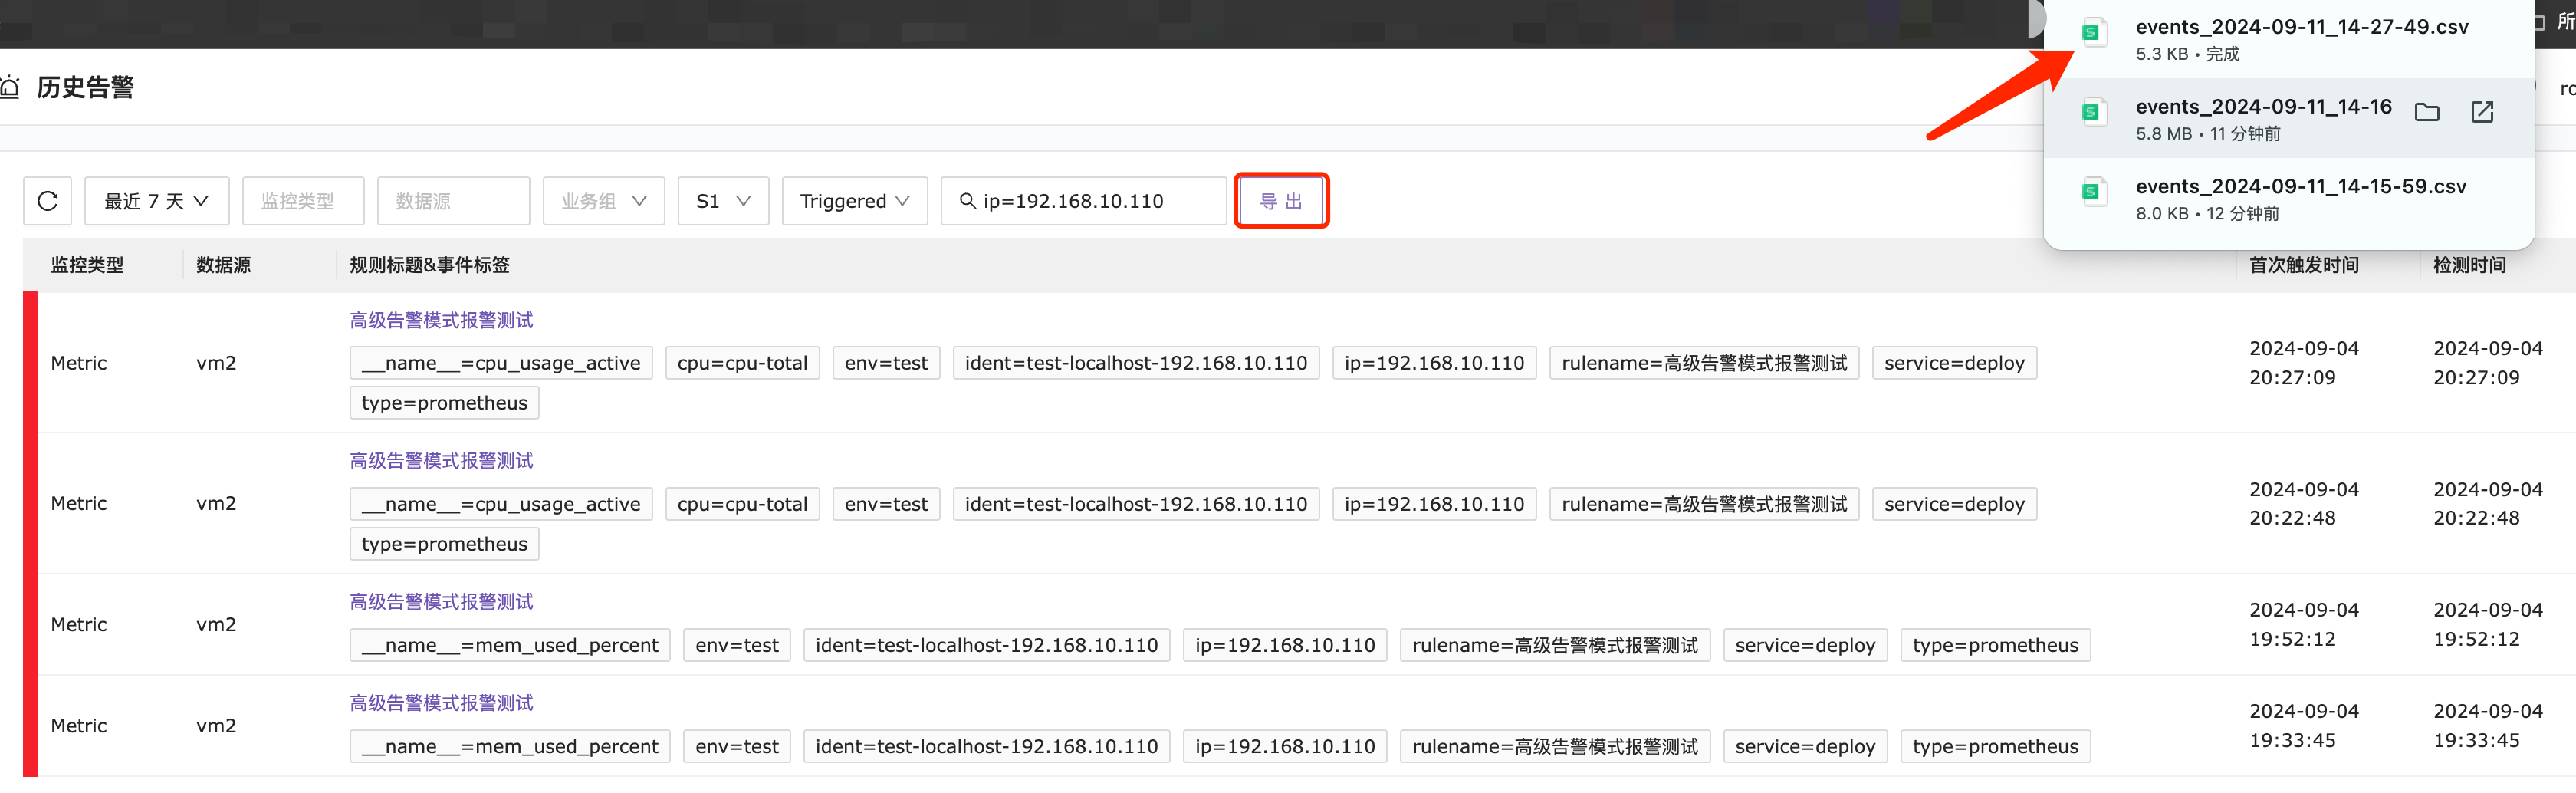
Final exported table.

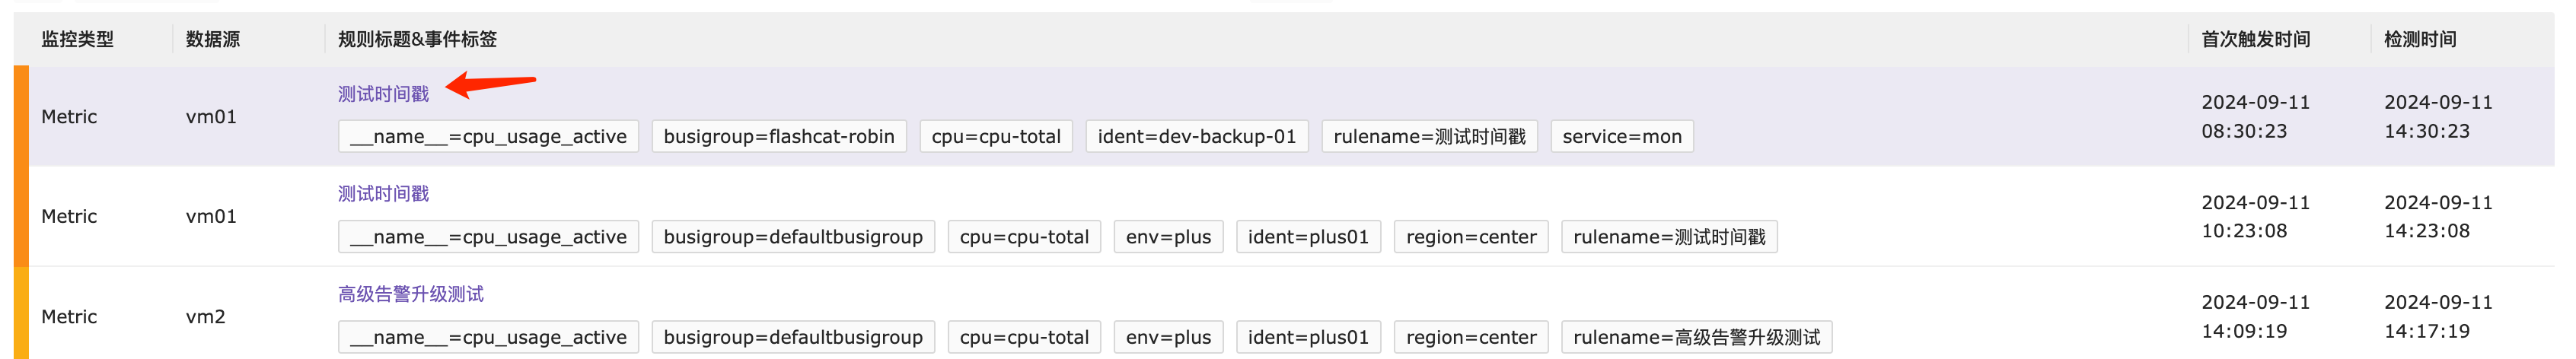
The second row explains the fields for the filtered information. It’s important to highlight the last two columns: the first trigger time and the detection time.
First Trigger Time: The time when the alert event was triggered for the first time.
Detection Time: The time when the alert event triggered based on the alert query cycle after meeting the alert threshold.
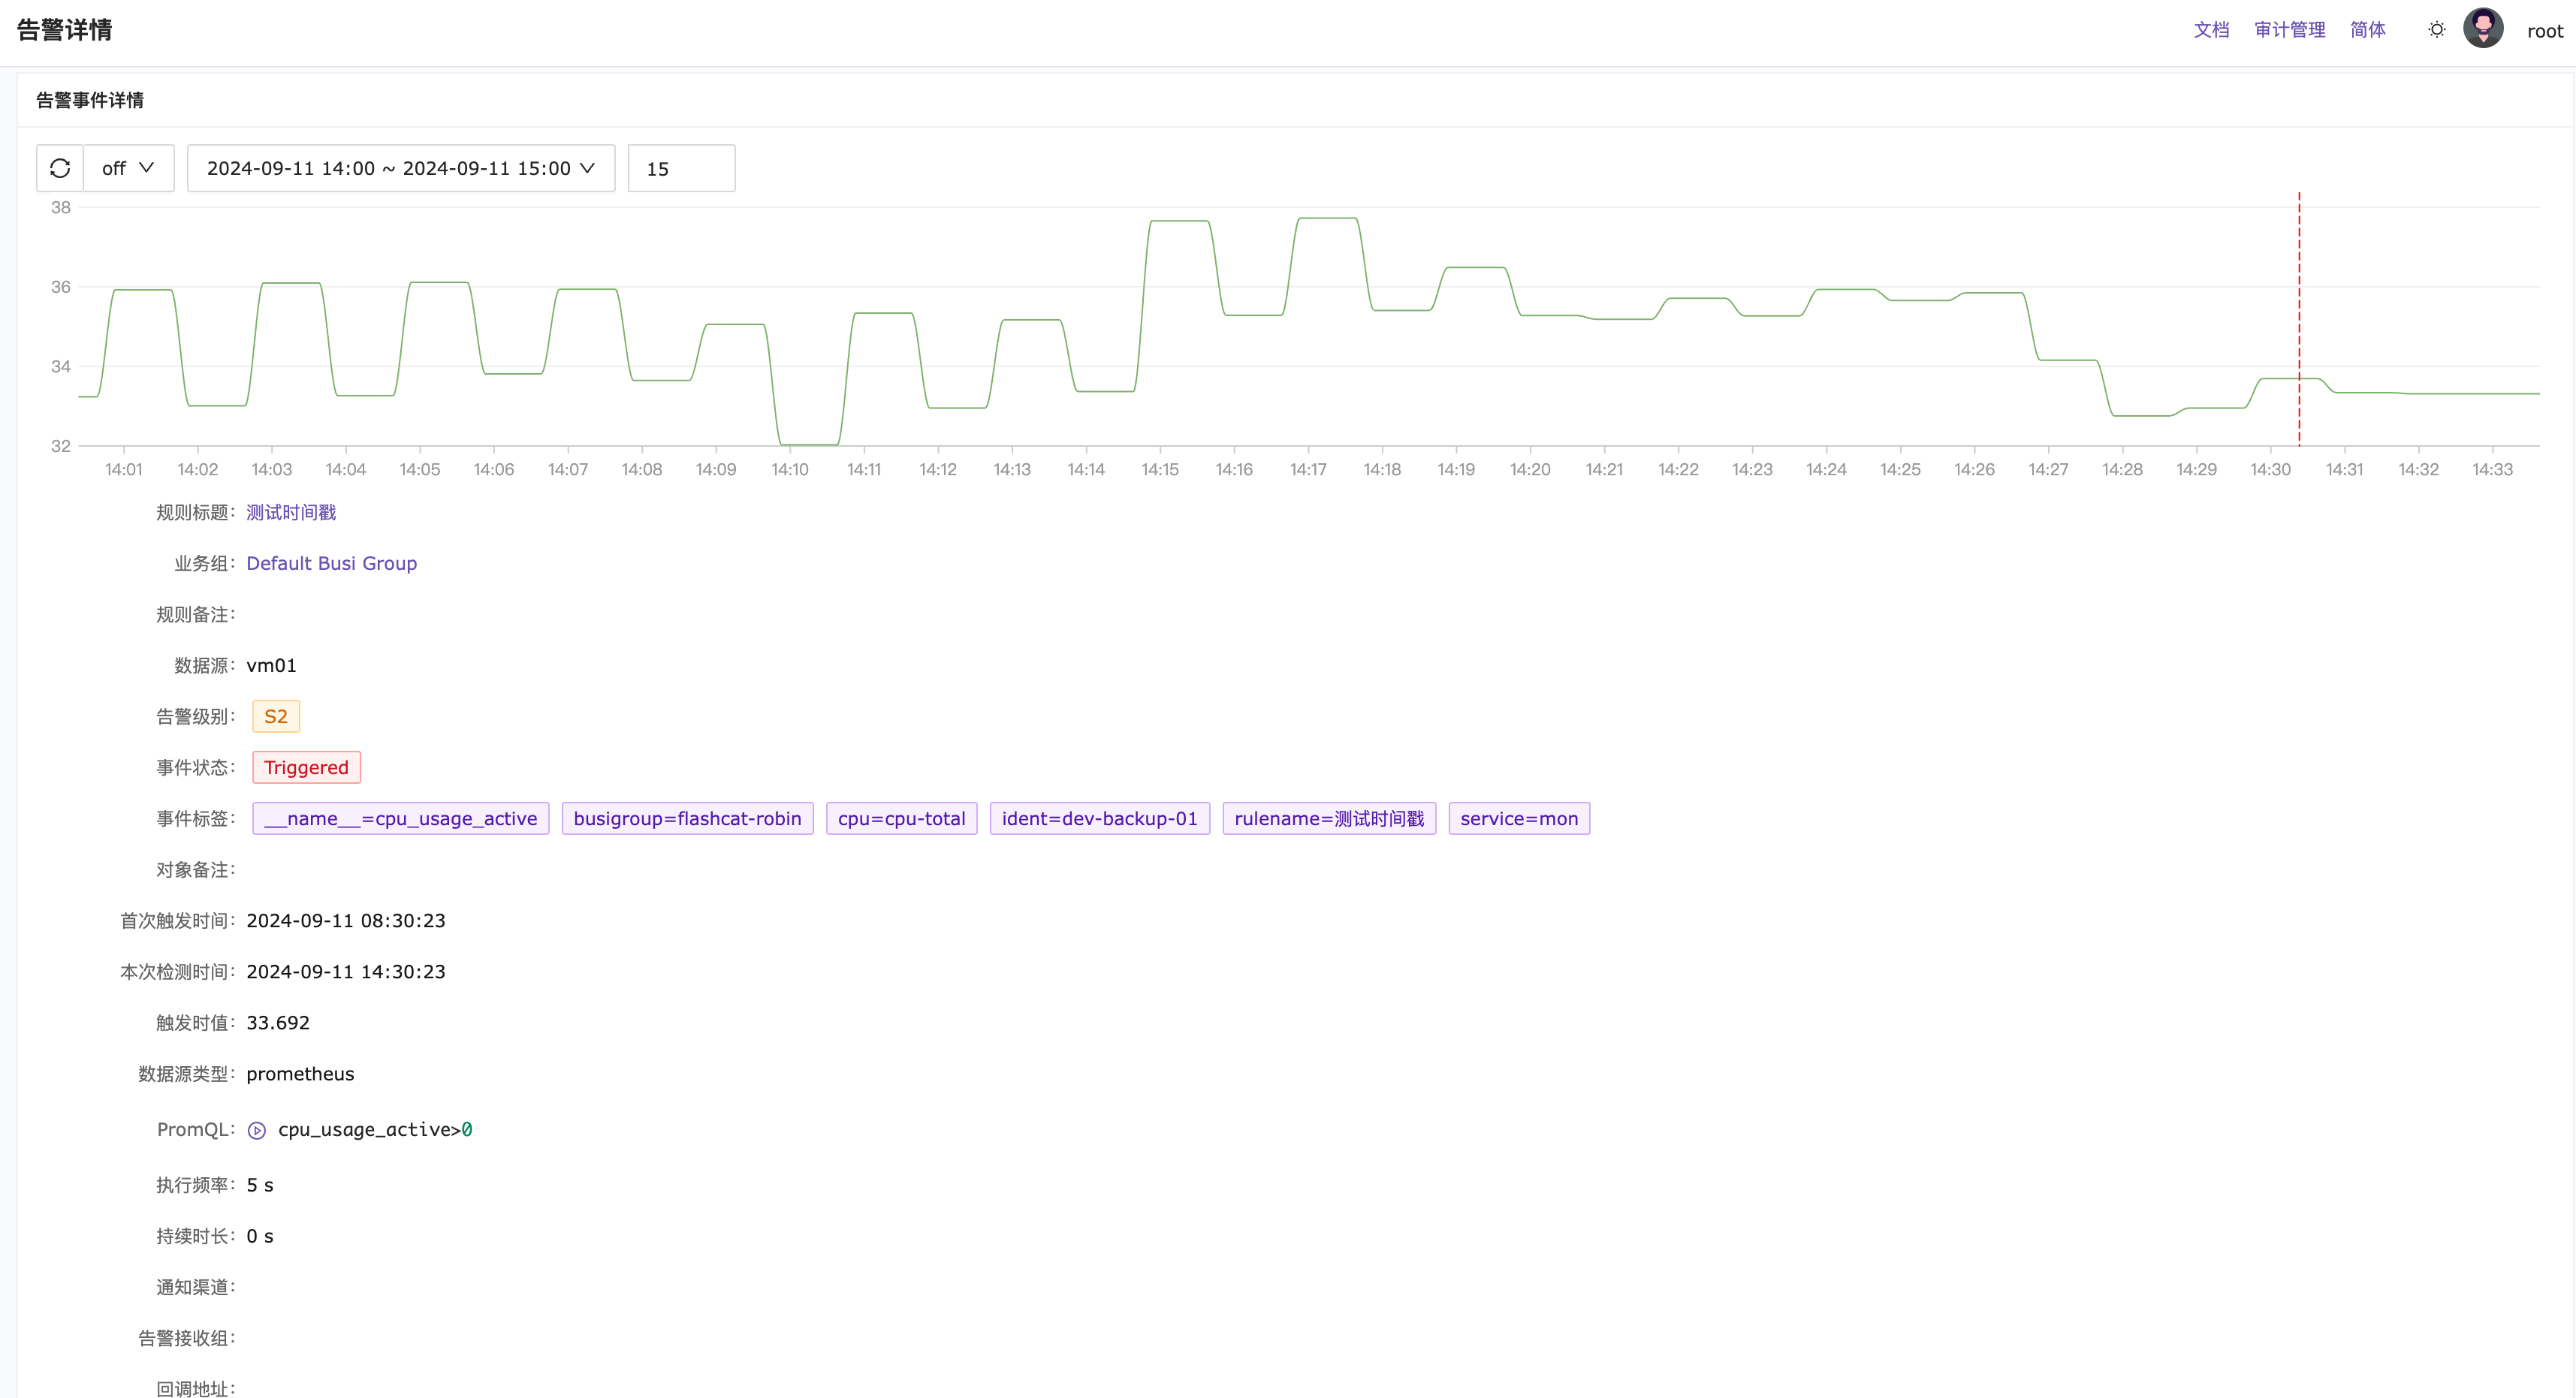
Clicking on the title of an alert event will navigate you to the alert detail page.
The alert detail page displays all the elements of the alert event.