

Deploying Jaeger
To demonstrate the integration with the Jaeger data source, we will use the Docker Compose deployment method recommended by the Jaeger official documentation. This method includes both Jaeger and a demo application, making it easier for us to learn and understand. This deployment method is not recommended for production environments.
Download and Start the Service
#Please ensure that `git` and `docker-compose` services are installed in advance, and test the network communication for pulling images.

git clone git@github.com:jaegertracing/jaeger.git jaeger && cd jaeger/examples/hotrod && docker compose up
After the deployment is complete, you can view the corresponding UI interface.
-
Jaeger UI: Access the service on port 16686.

-
Demo: Access the service on port 8080. For more demo configurations, you can refer to the documentation.

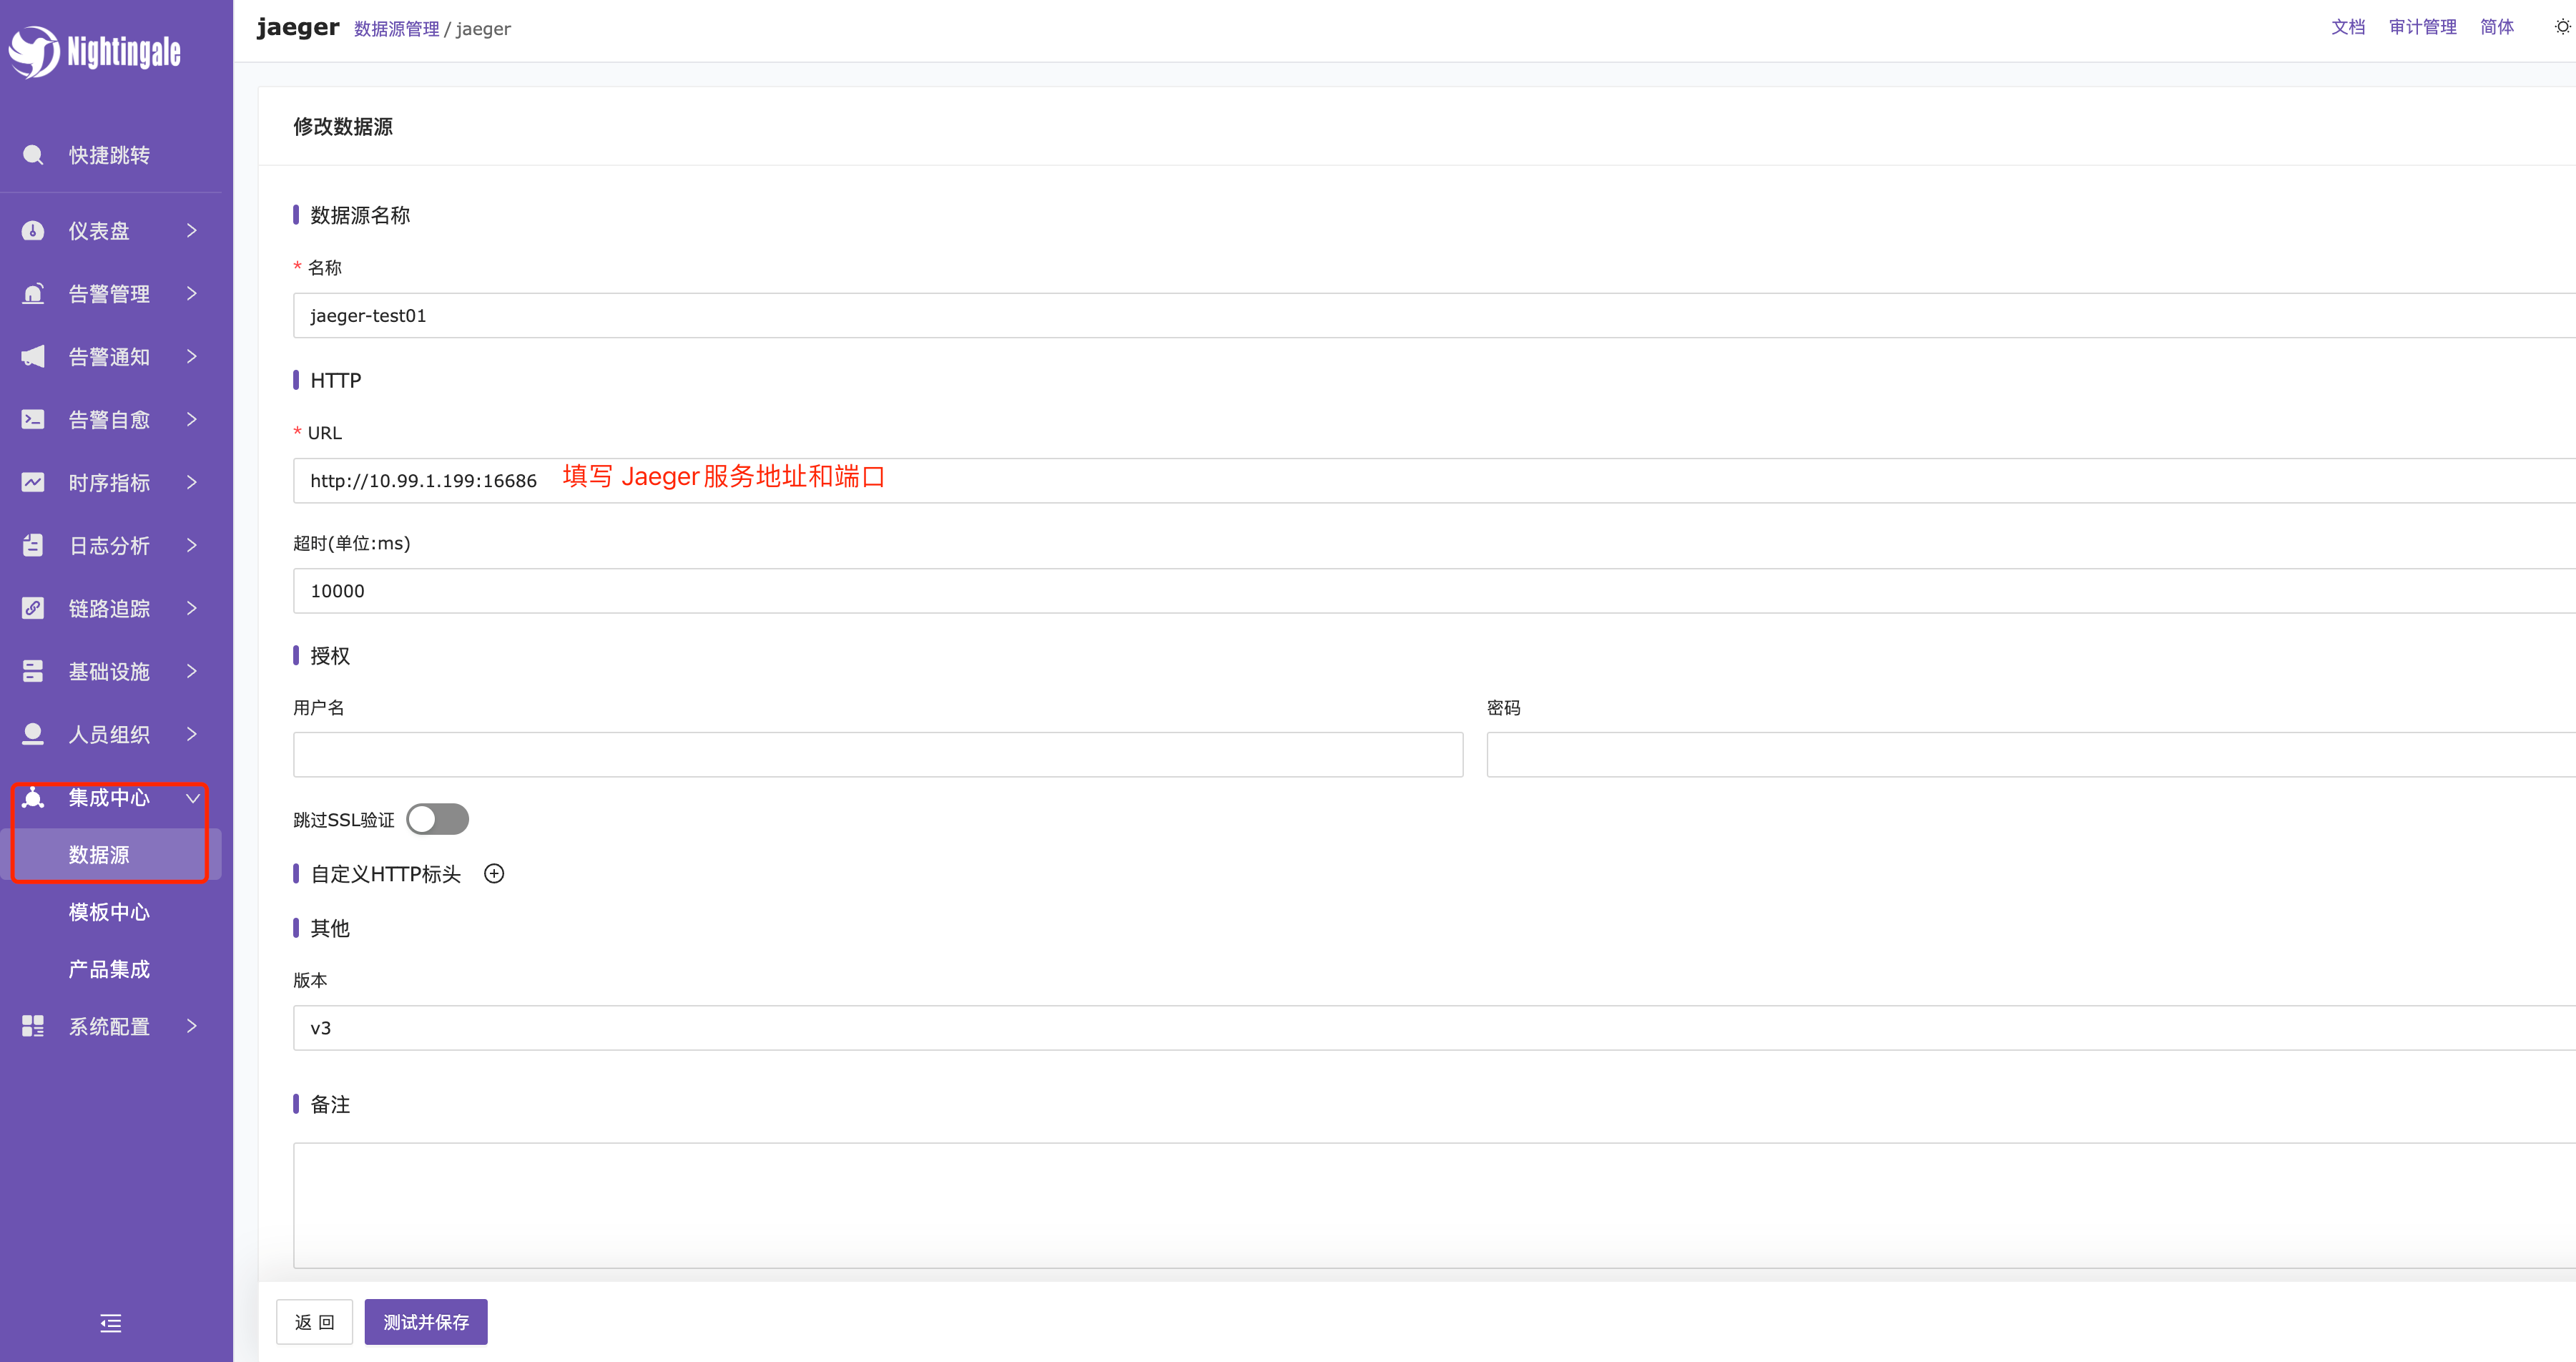
Integrating Jaeger Data Source
Fill in the Jaeger service address and port.

Querying Jaeger
-
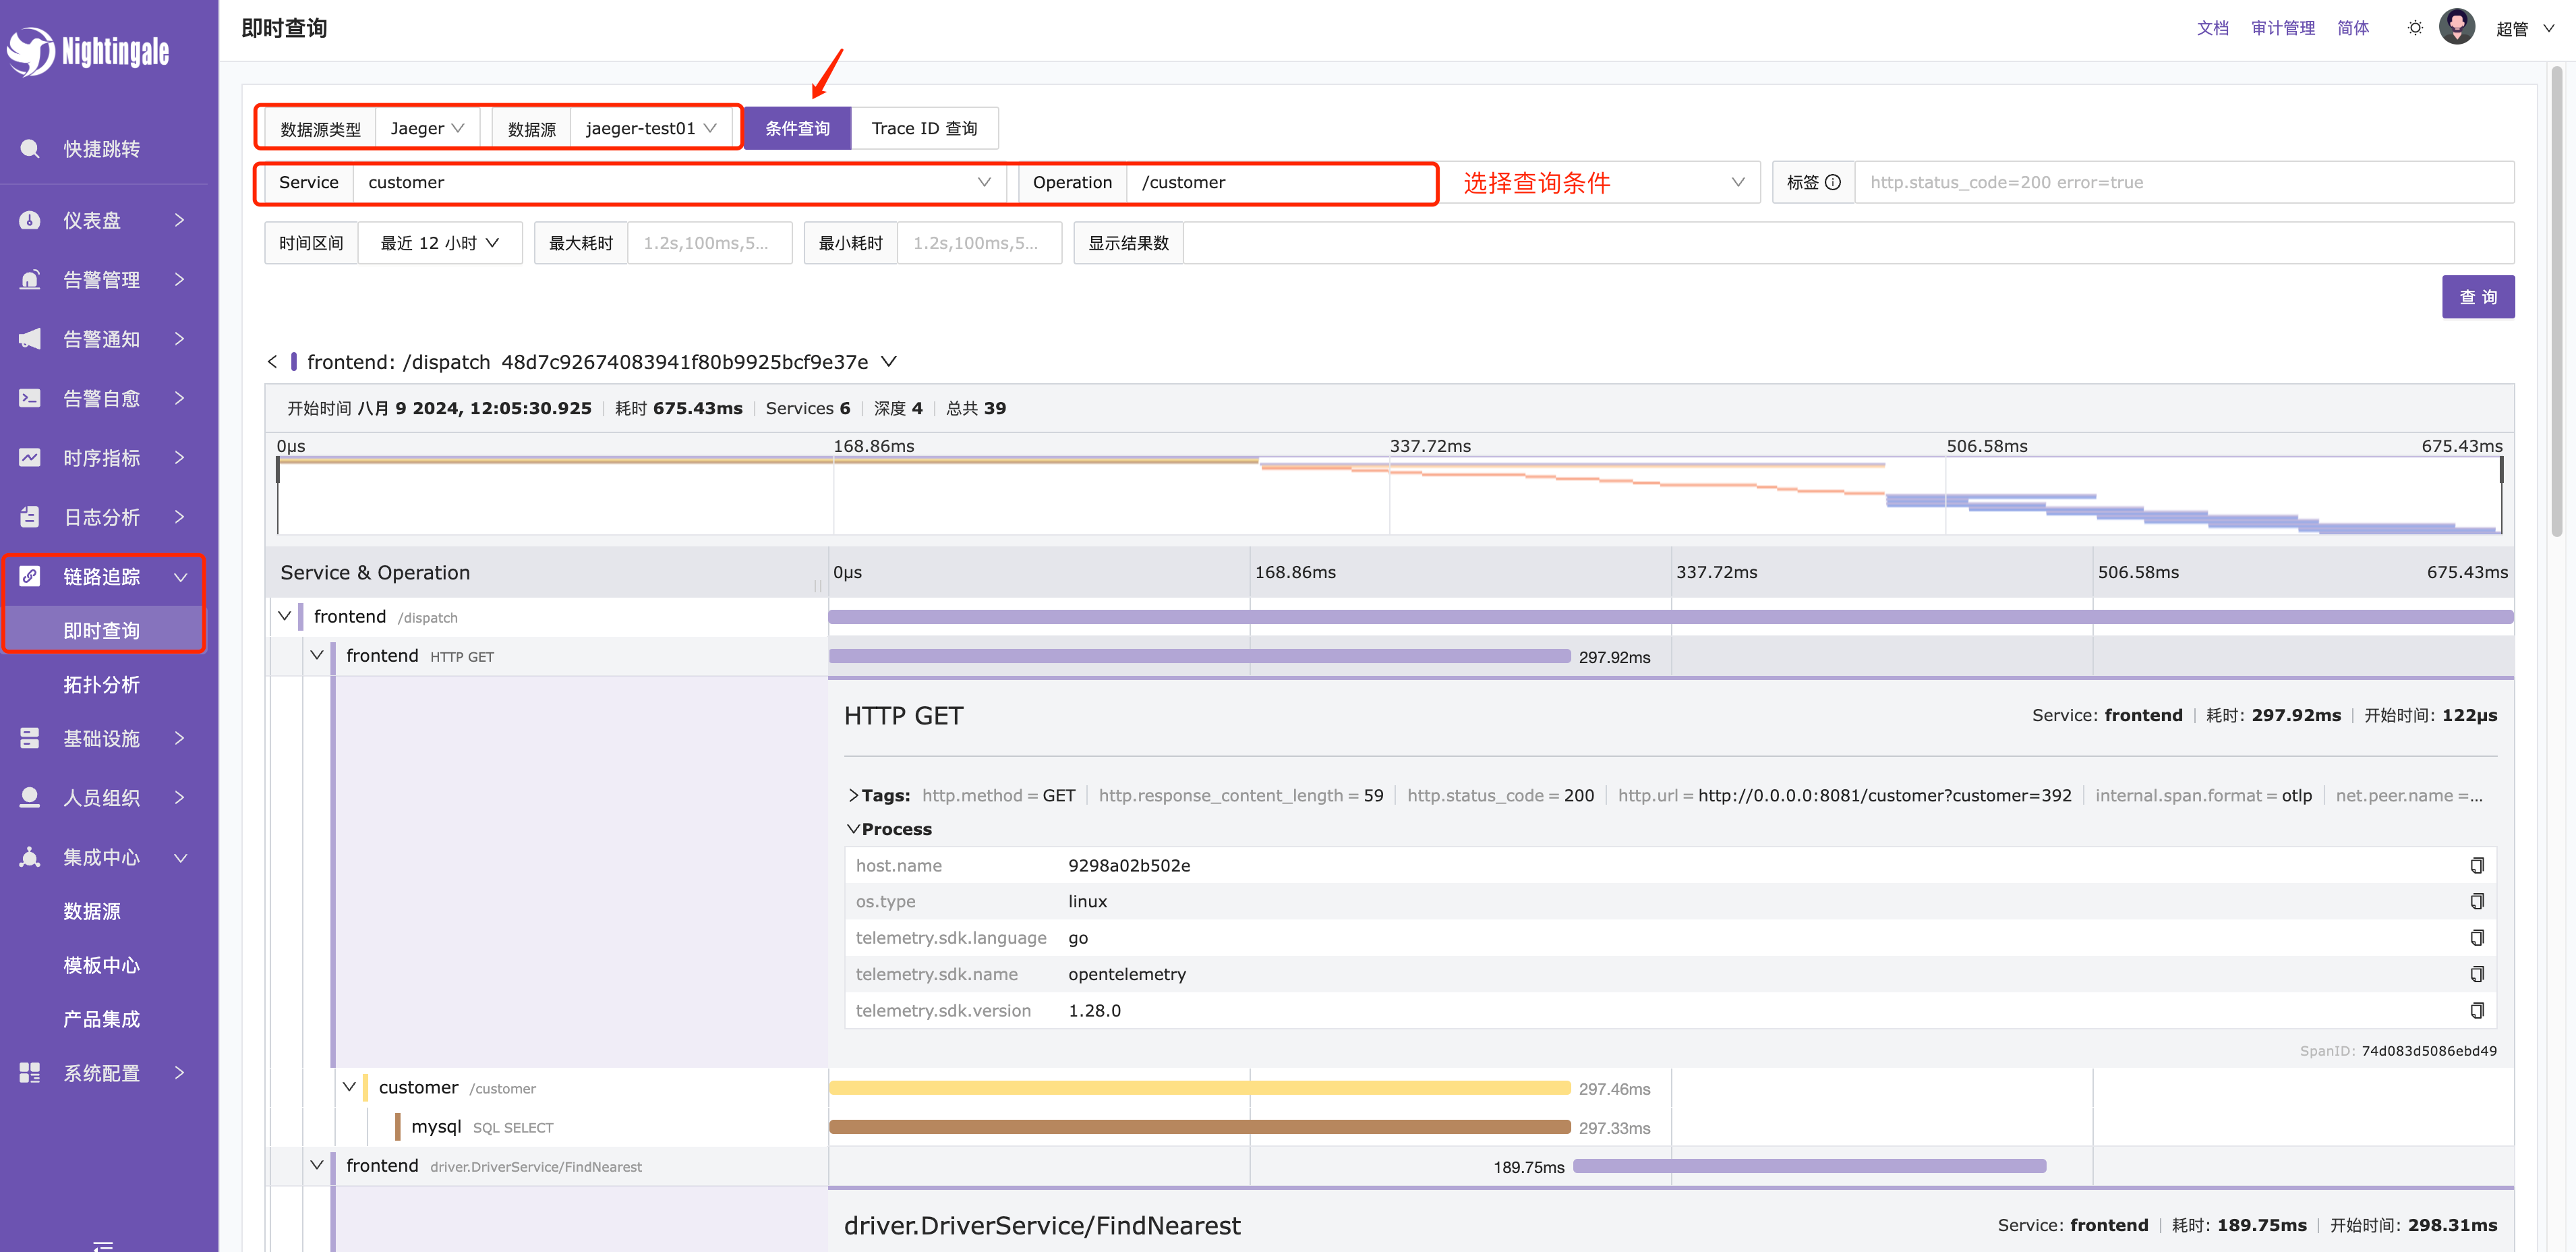
Trace → Select Jaeger Data Source
-
Query by Condition

-
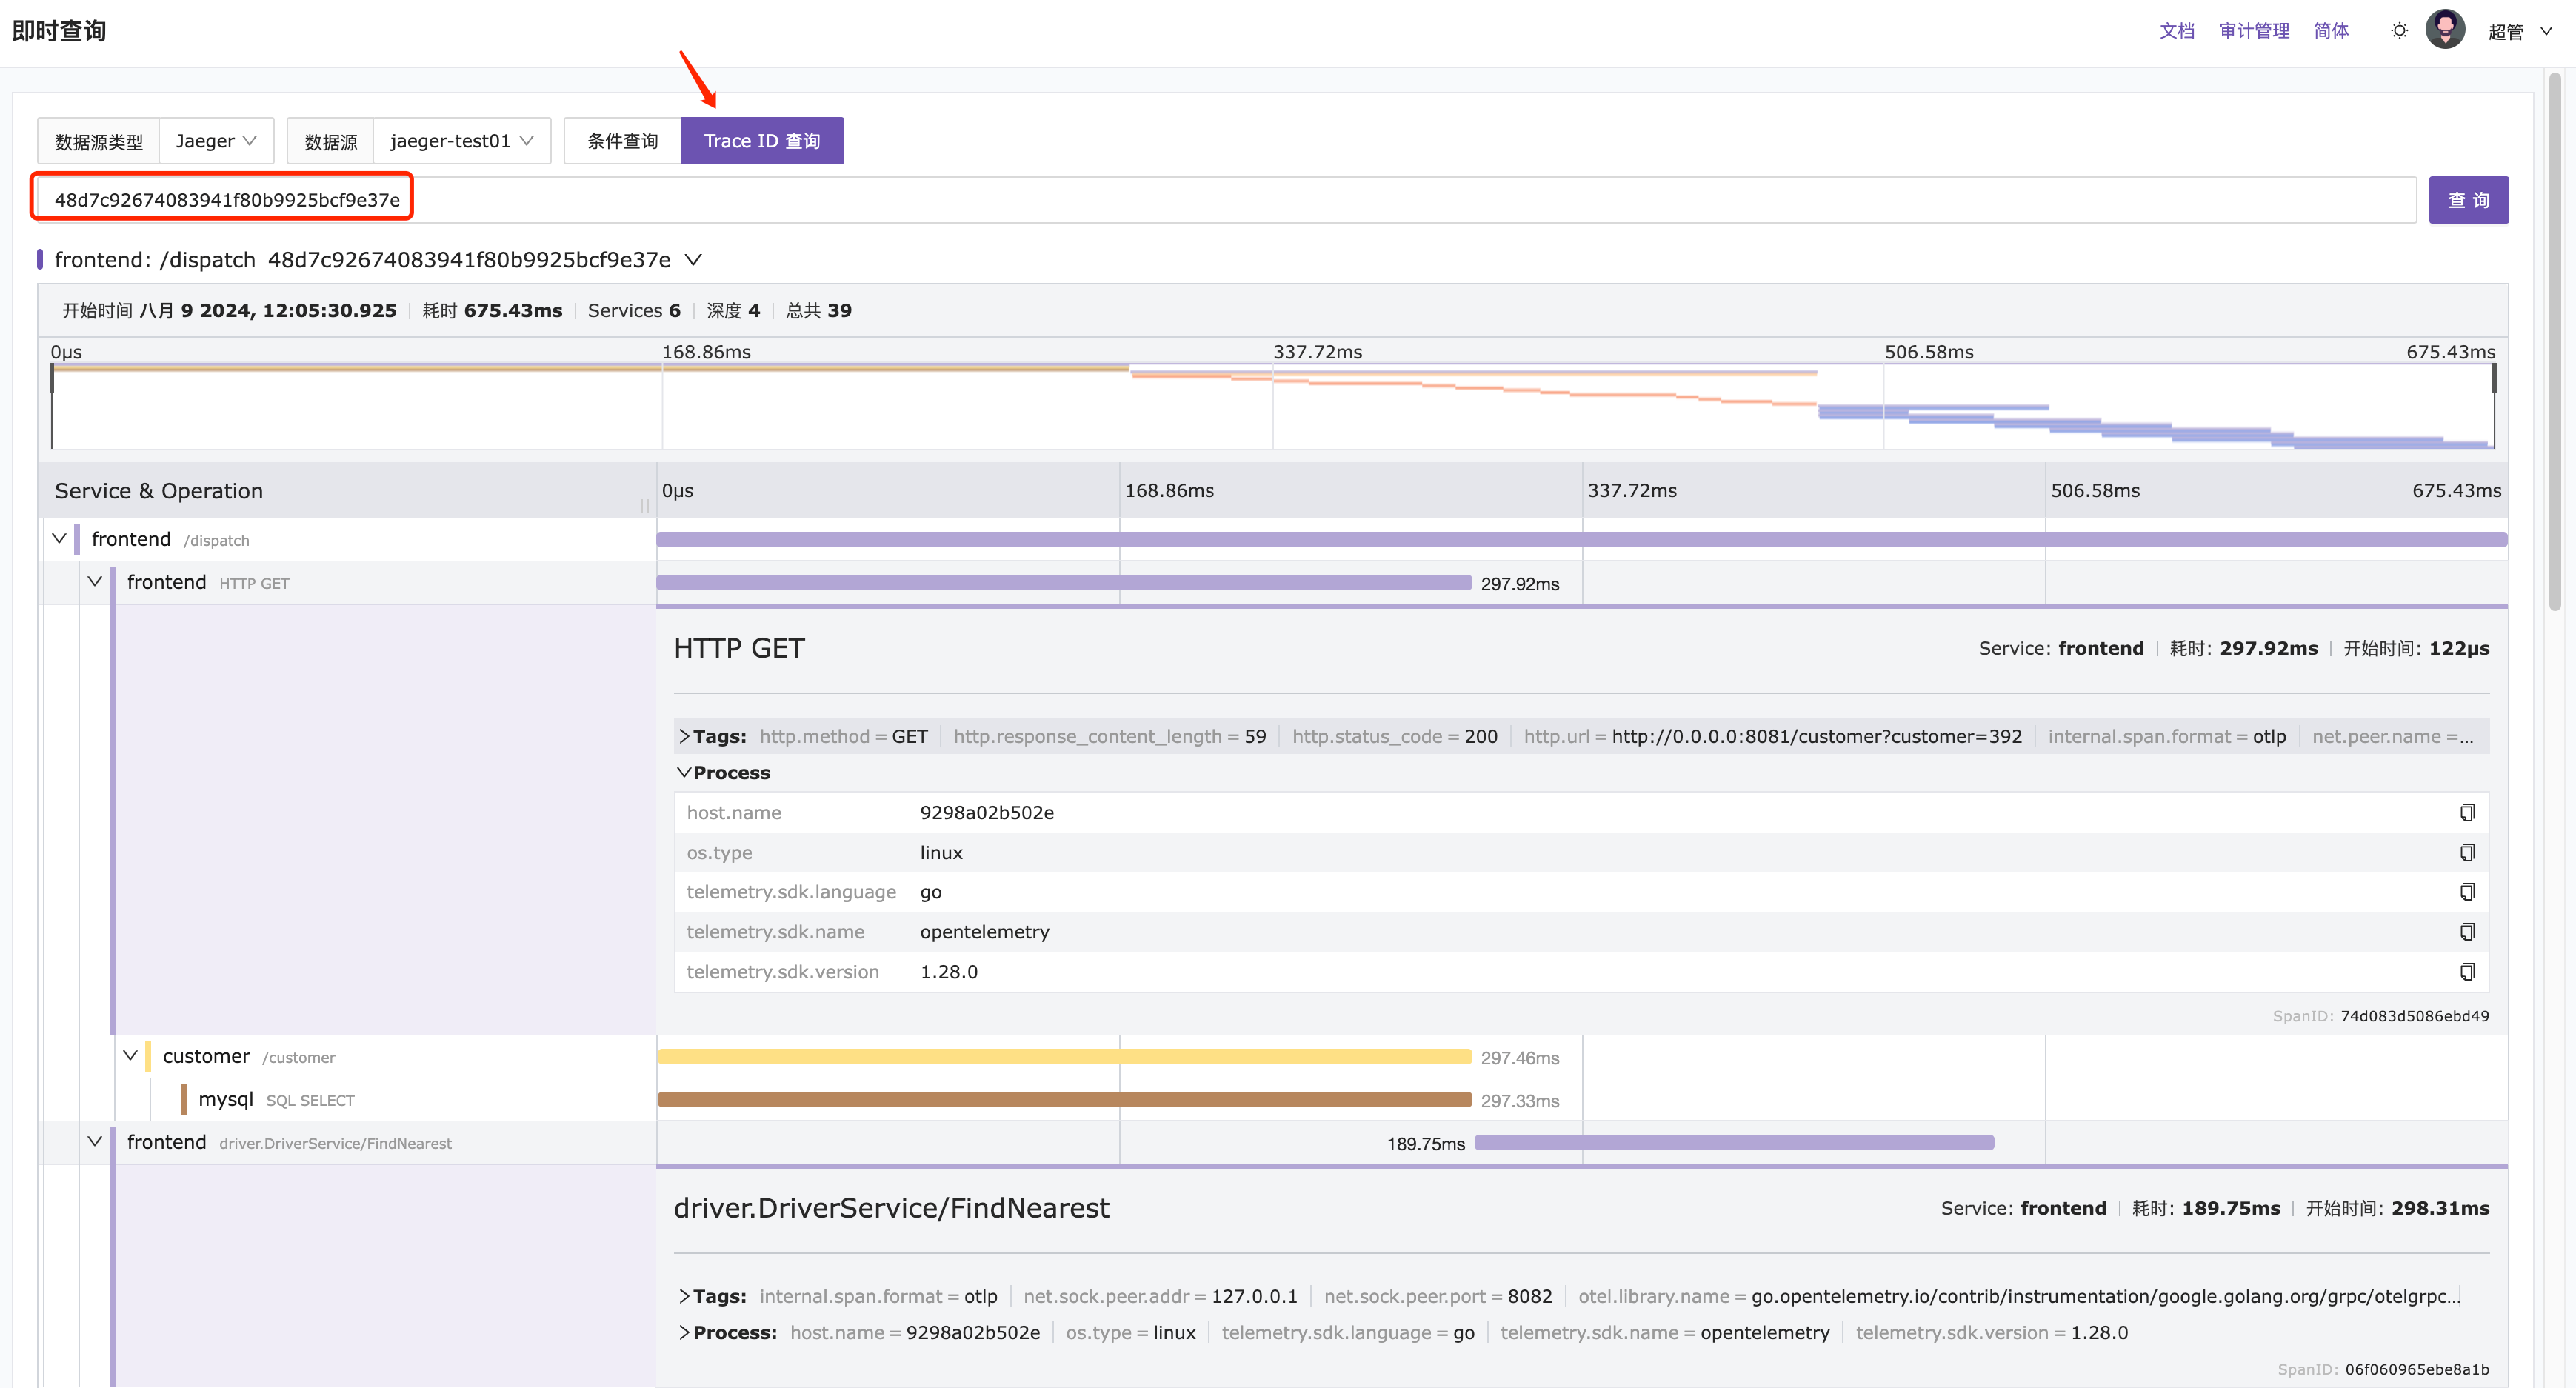
Trace ID Query

-
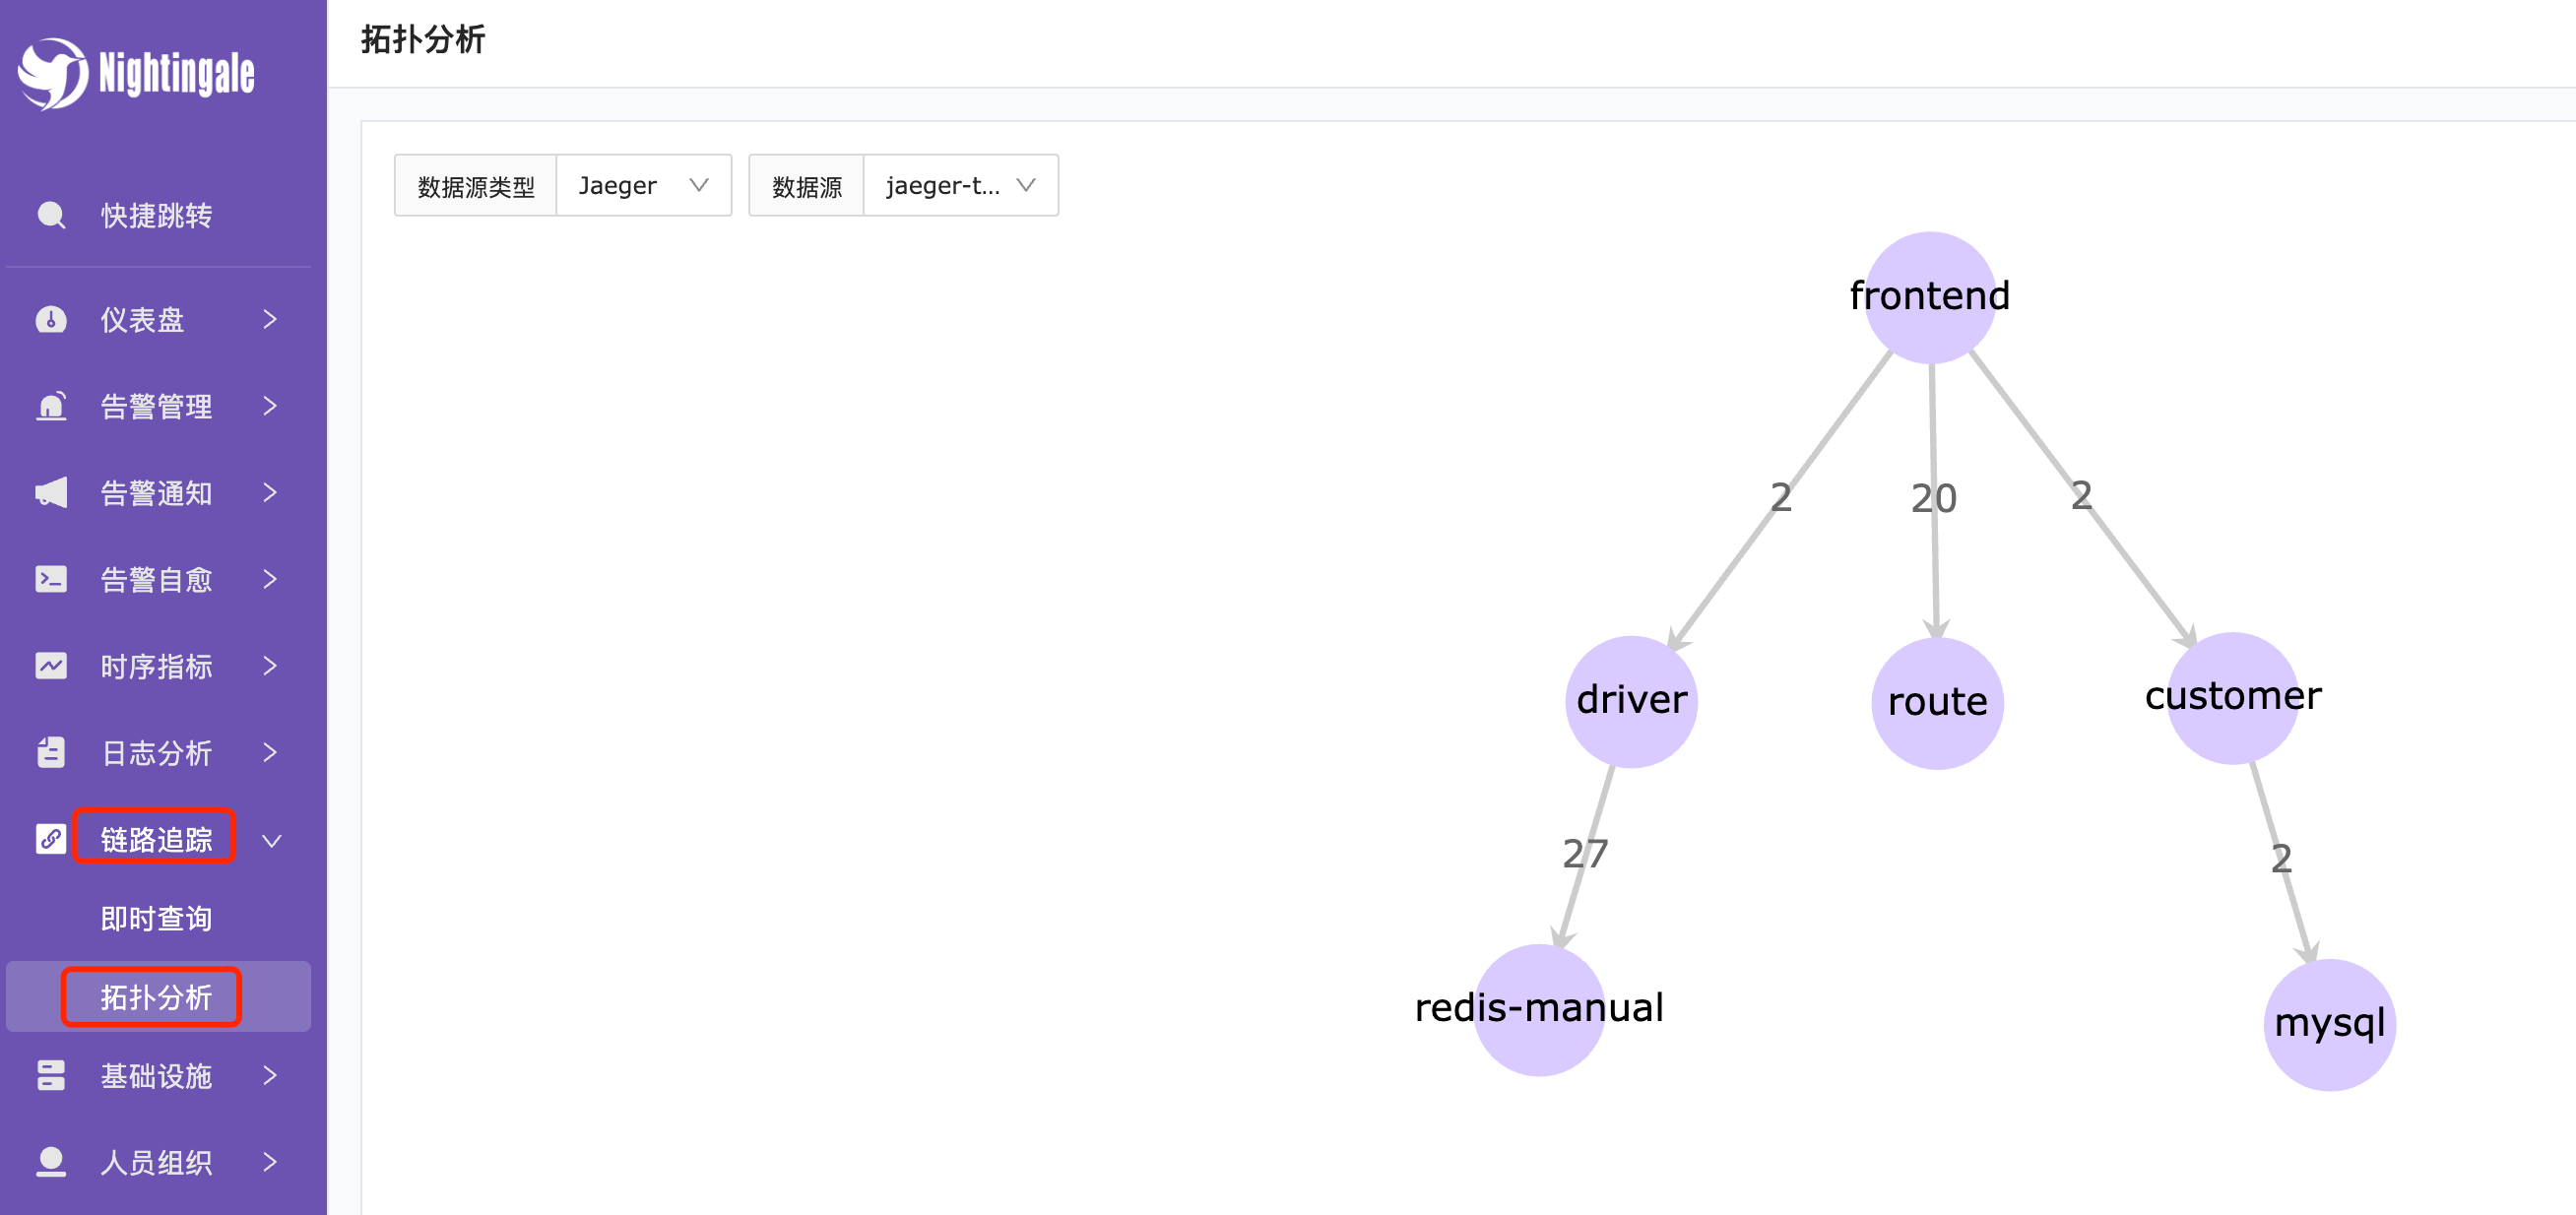
Topology Analysis
Trace → Topology Analysis
Similarly, select the Jaeger data source, and observe the interactions between services to automatically build a topology analysis chart. The service elements in the chart can be freely dragged and displayed.


