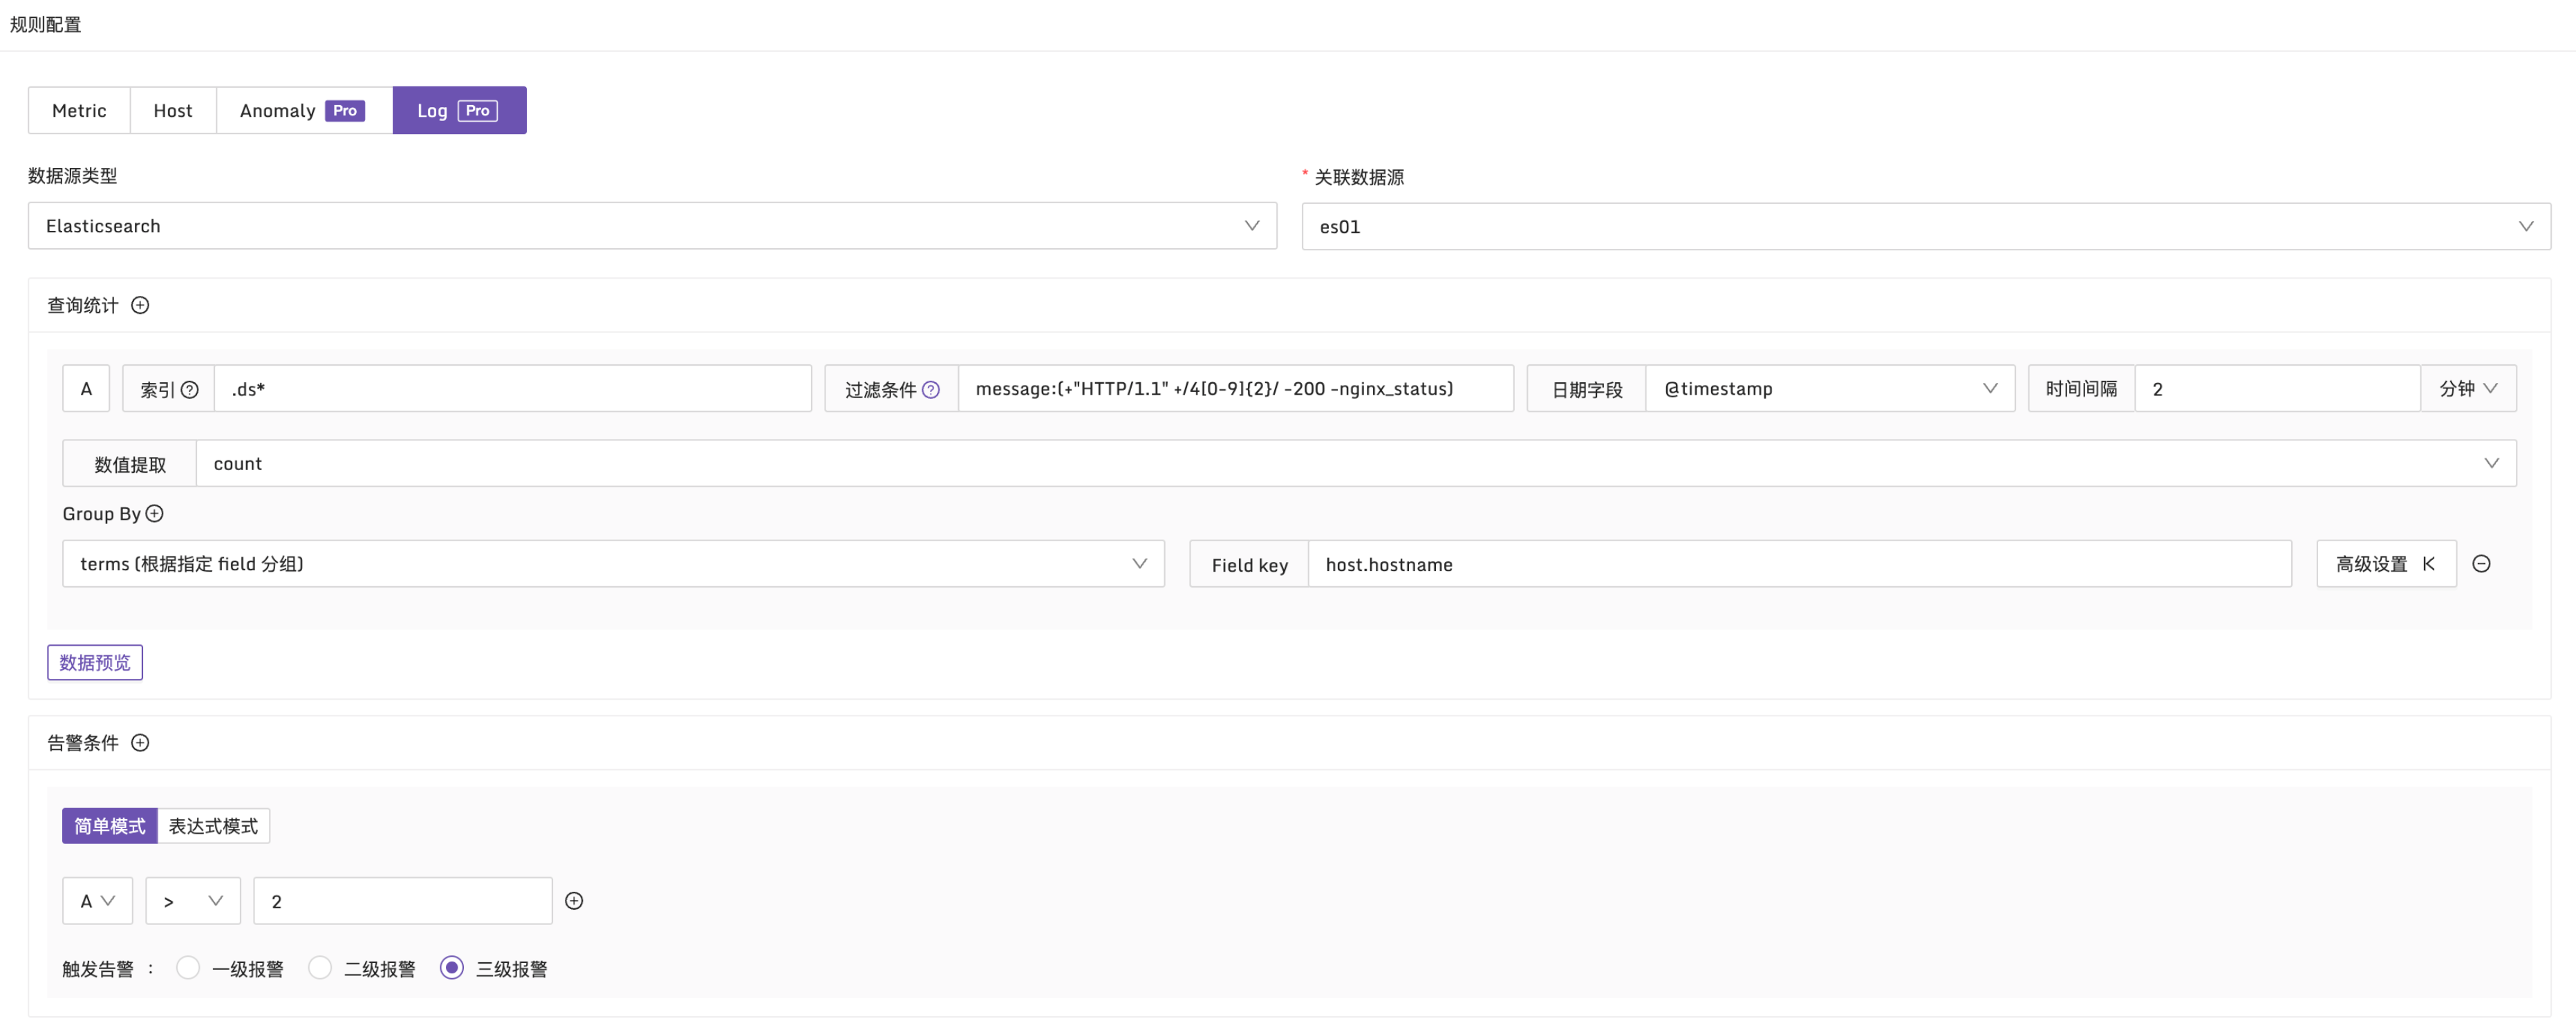


Log type alert rules are very similar to conventional metric alert rules, with the only difference being how the alert conditions are set. Metric alert rules use PromQL as query conditions, while log type alert rules use Boolean expressions as query conditions. These alert conditions (such as A, B, etc.) need to be obtained through query statistics.
When configuring query statistics, you’ll notice that it is similar to an ES log query, where you first select the index, query conditions, and date fields. Additionally, there are two extra data field groups: Value Extraction and Group By.

To obtain numeric results, you need to use value extraction and choose the appropriate statistical functions. In addition to common functions such as count, sum, avg, min, and max, percentile functions like p90, p95, and p99 are also supported.
Moreover, by configuring Group By, you can group the results by specific fields. This will generate multiple time series and trigger multiple alert events when the alert conditions are met.
Example 1: Alert condition for HTTP CODE 4xx
Explanation: In every 10-minute period, check the message field in the logs. If the number of 4xx logs exceeds 2, an alert will be triggered, and it will be grouped by the host.hostname field. The configuration is as follows:

Example 2: Trigger alert when API response time exceeds 1 second
Explanation: Group by http_method and check if the request interface response time exceeds 1 second. The configuration is as follows:

Example 3: Trigger alert when request_time exceeds 1900ms and there are more than 10 logs
Explanation: In every 2-minute period, filter logs where request_time exceeds 1900ms. Group by request_uri and check if the log count exceeds 10. The configuration is as follows:

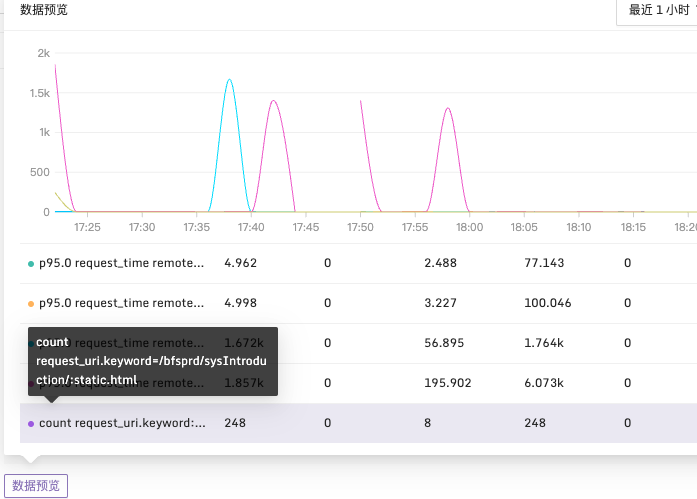
After configuring the required data fields, you can also preview the query results using the data preview button.


