


Writing a Network Device Collection Template
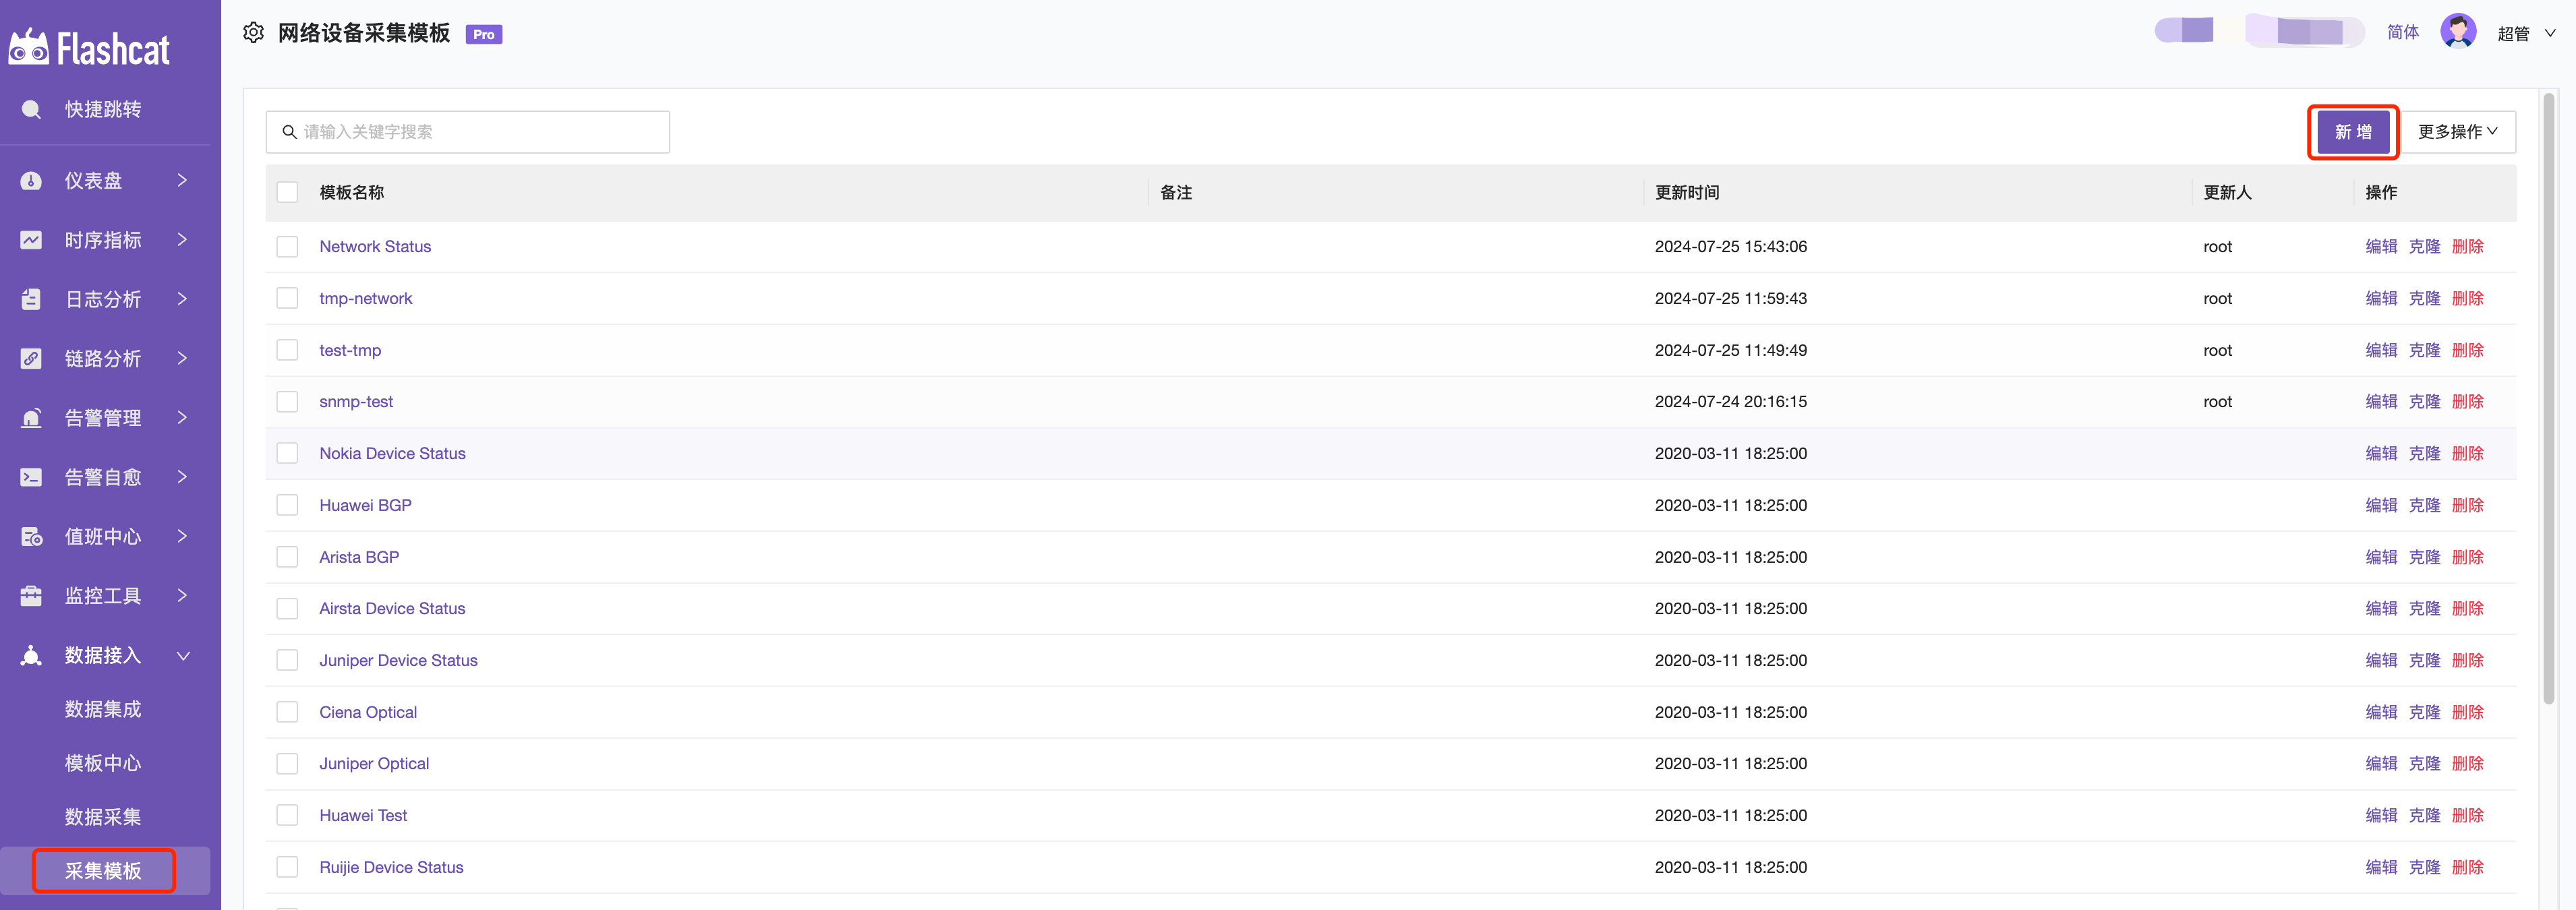
Click “New” in the top-right corner of the collection template to add a custom collection template.
Below is an example of a custom collection configuration for an SNMP device and basic parameter descriptions.
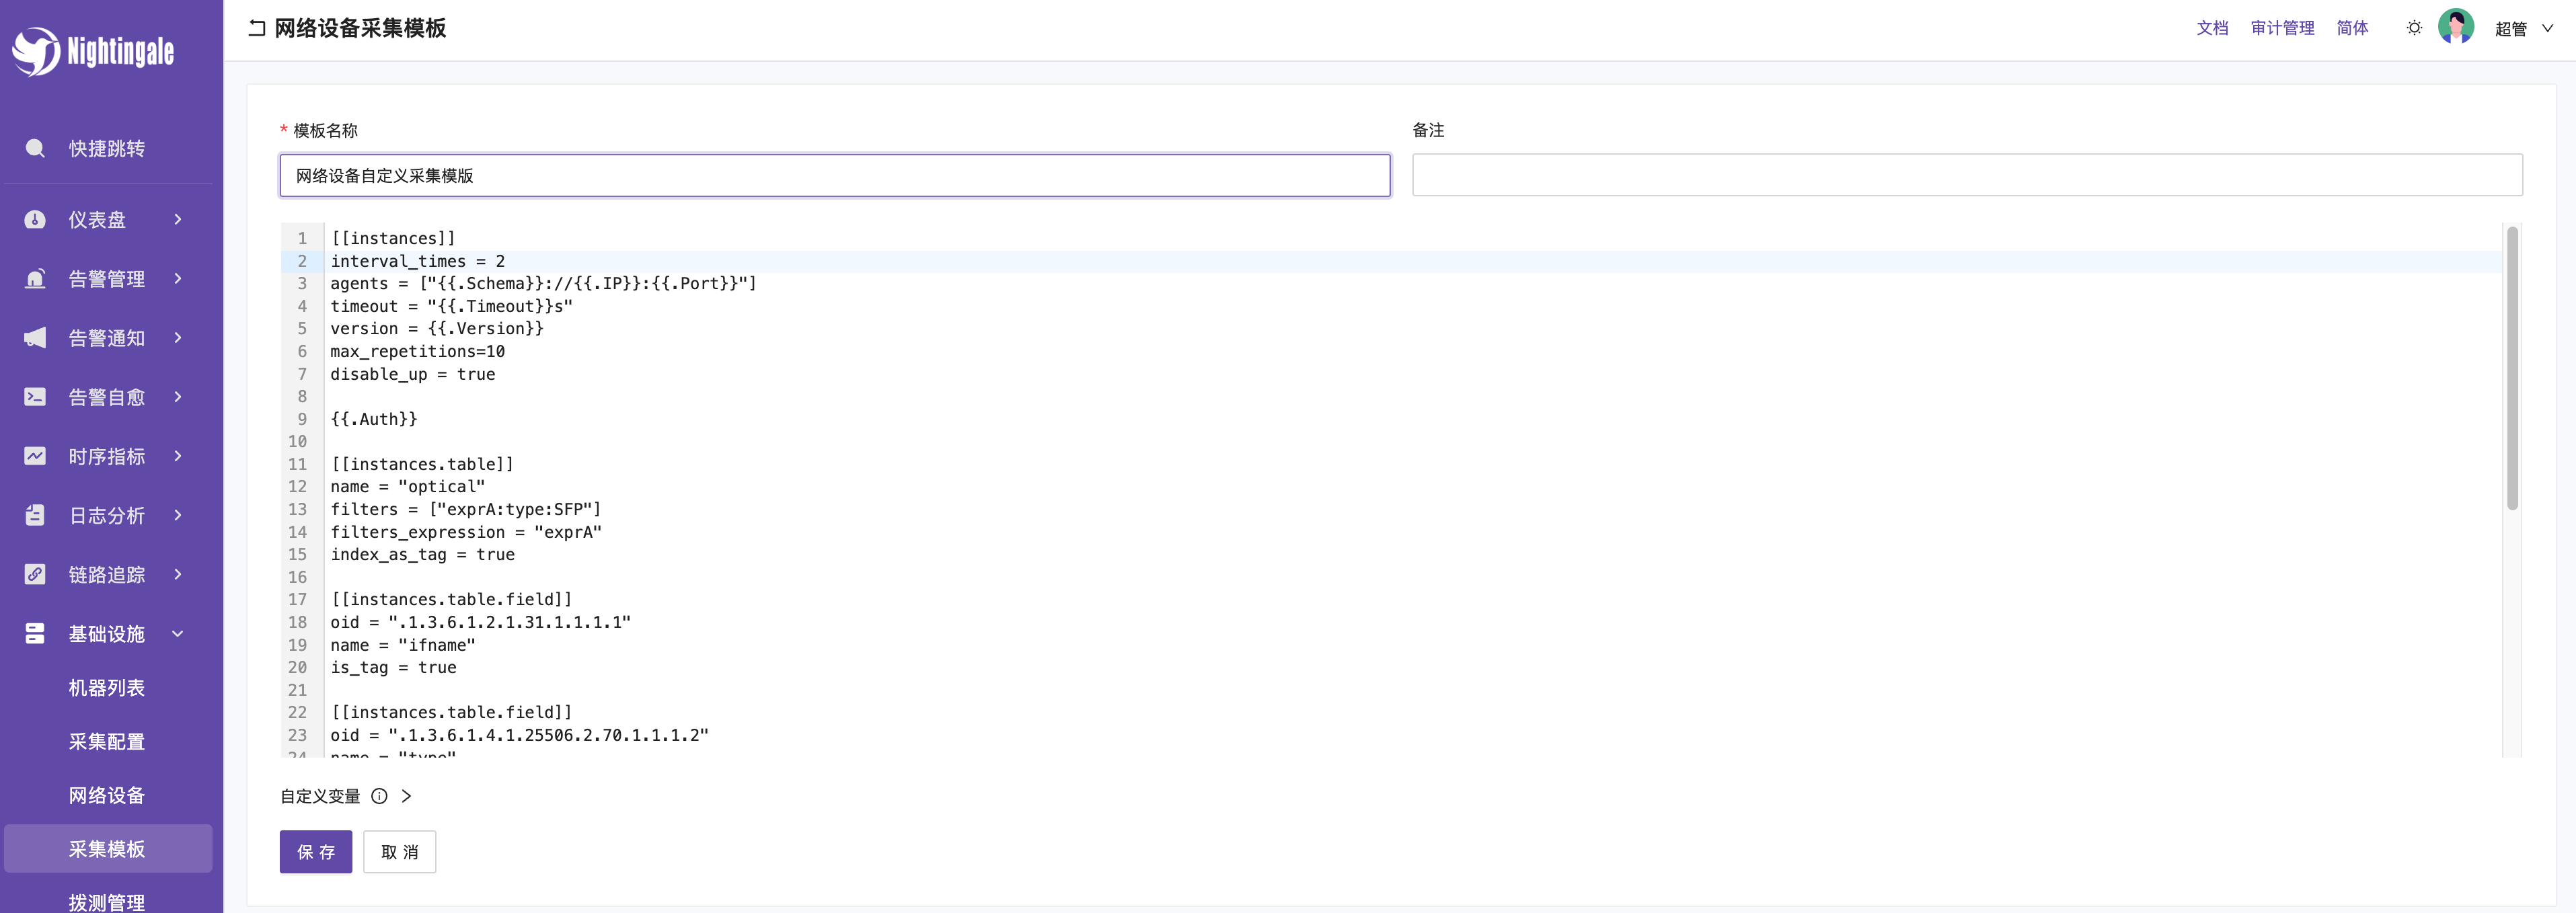
Basic Parameter Descriptions
agents: Configure the collection information address, port, and protocol;
Format: agents = ["<scheme://><hostname>:<port>"]
scheme: The protocol type, default is UDP. Currently supports udp, udp4, udp6, tcp, tcp4, tcp6.
hostname: The collection address.
port: The port number of the collection address.
Example:
agents = ["udp://127.0.0.1:161"] means using the UDP protocol to connect to the local address 127.0.0.1 on port 161.
agents = ["tcp://127.0.0.1:161"] means using the TCP protocol to connect to the local address 127.0.0.1 on port 161.
If using network devices for collection
The configuration file can be written as follows to automatically call the corresponding fields in network device collection.
[[instances]]
agents = ["{{.Schema}}://{{.IP}}:{{.Port}}"]
interval_times = 1
timeout = "{{.Timeout}}s"
version = {{.Version}}
#retries = 3
max_repetitions=15
disable_up = true
{{.Auth}}
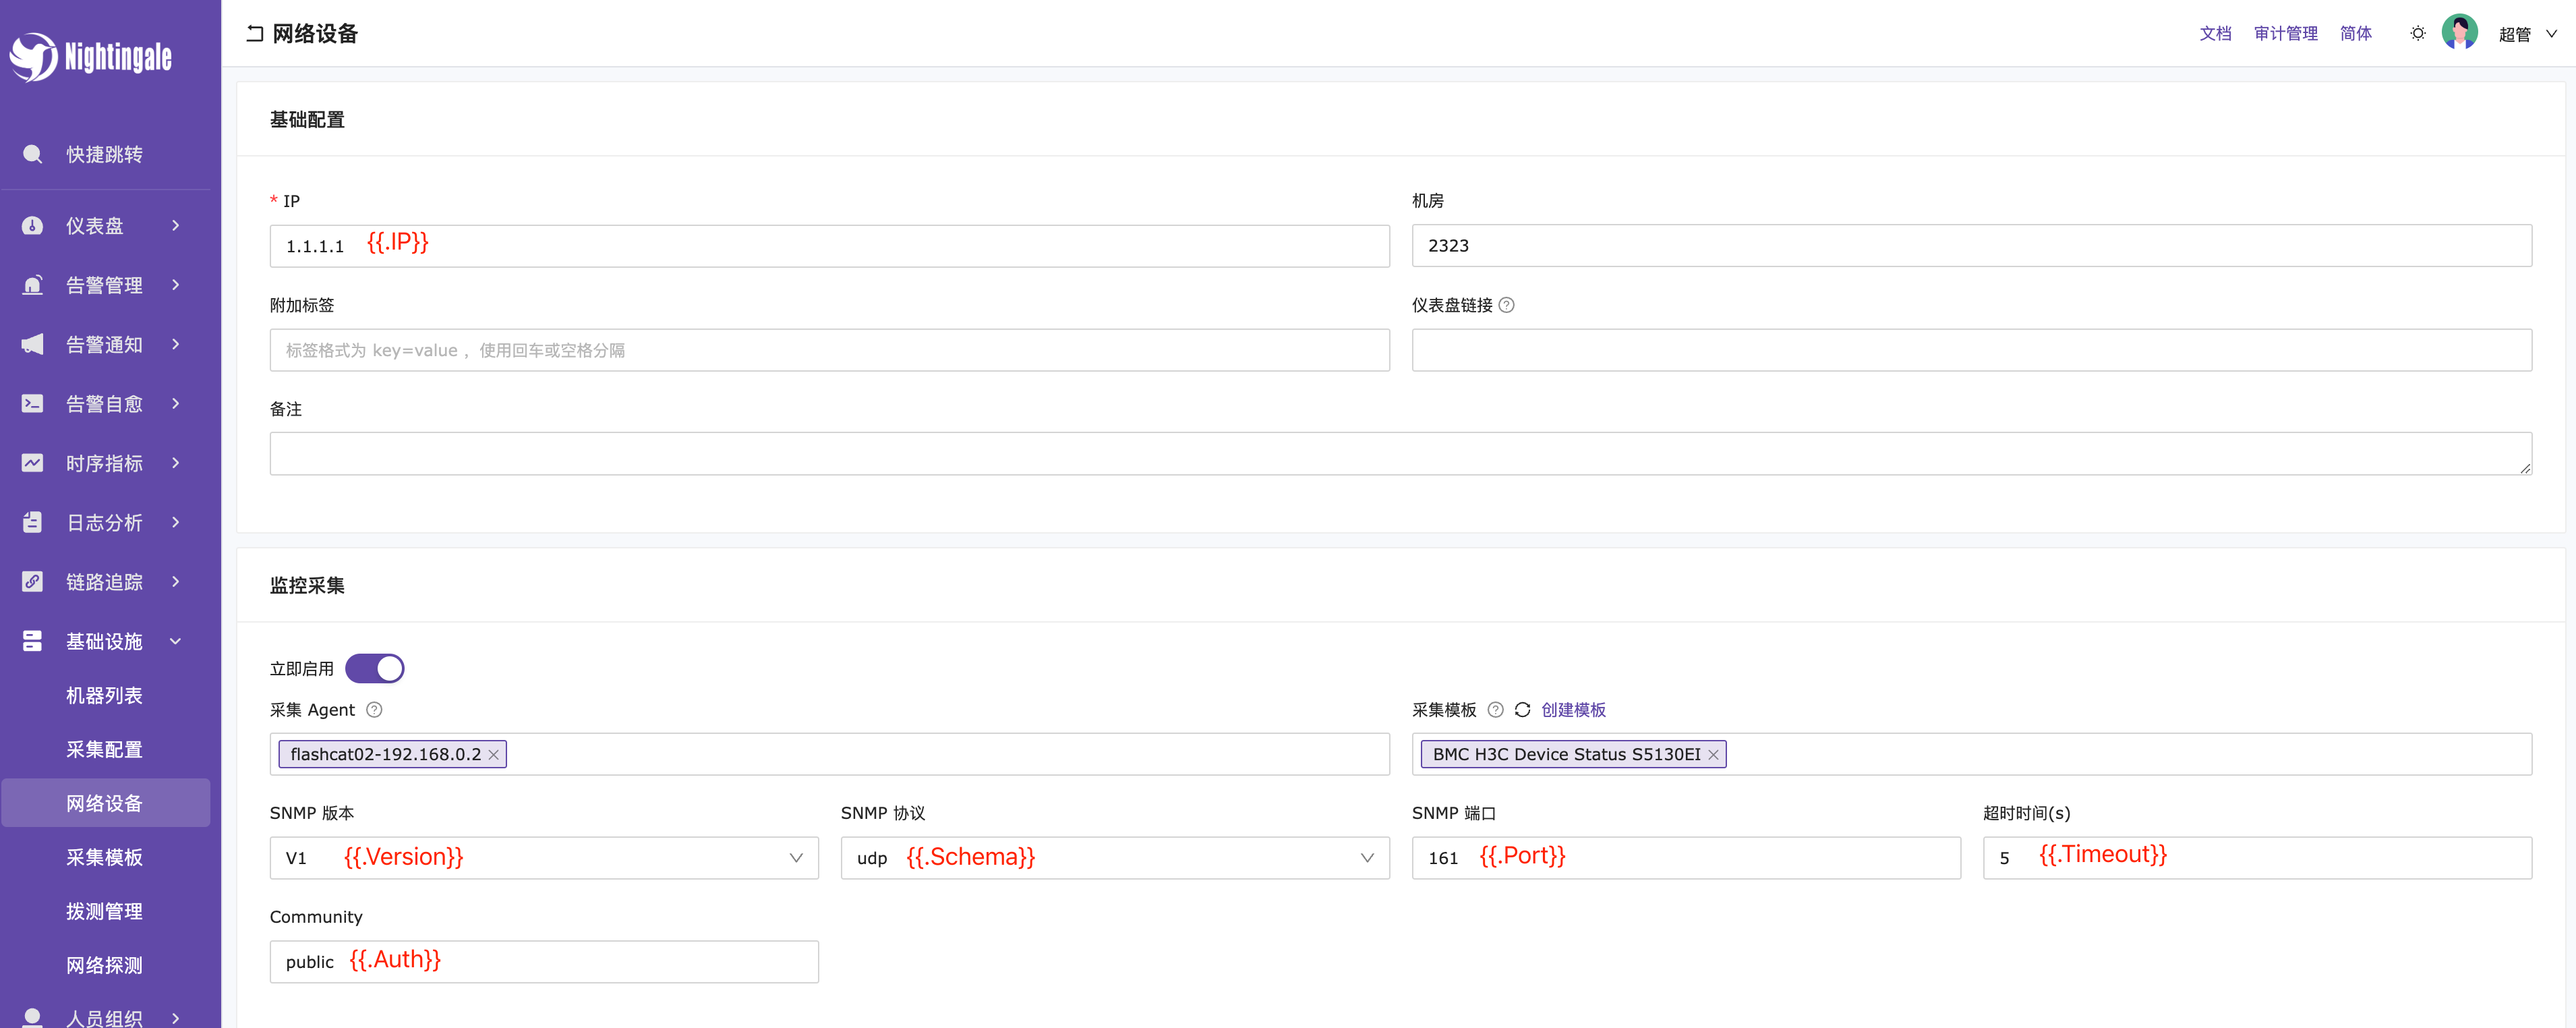
As shown in the image below, you can map the fields filled in the configuration, and during collection, the corresponding values of the variables will be automatically fetched.
{{.IP}} == IP
{{.Schema}} == SNMP Protocol
{{.Port}} == SNMP Port
{{.Timeout}} == Timeout (s)
{{.Version}} == SNMP Version
{{.Auth}} == Community
community: A parameter obtained from the device configuration file or management interface, usually set to “public”.

agent_host_tag: Label name for reporting the IP of the device.
retries: The number of times the system will retry if an SNMP request fails.
max_repetitions: The maximum number of objects requested in a single SNMP request. Note: Increasing this value may reduce the number of requests, but it may also increase network load.
Retrieving Scalar Data Types: These data points are identified by a single OID in the MIB.
# Retrieving Scalar Data
# CPU System Usage Rate
[[instances.field]]
oid = "1.3.6.1.4.1.2021.11.9.0"
name = "cpu_usage_sys"
# CPU User Usage Rate
[[instances.field]]
oid = "1.3.6.1.4.1.2021.11.10.0"
name = "cpu_usage_user"
# Device Free Memory
[[instances.field]]
oid = "1.3.6.1.4.1.2021.4.6.0"
name = "mem_free"
Retrieving Table Data: Includes multiple columns of data and multiple indexes. Categraf will automatically retrieve all index fields in the Table as labels for time series data and automatically gather all data columns as metrics.
# Retrieving Table Data
[[instances.table]]
oid = "IF-MIB::ifTable"
name = "interface"

[[instances.table.field]]
oid = "IF-MIB::ifDescr"
name = "ifDescr"
# Some columns may not be numeric, such as ifDescr, which is a string. This column should not be reported as a metric but rather as a label, so there's a configuration with is_tag=true.
is_tag = true
OID: An identifier used to uniquely identify each managed object in network management protocols like SNMP. It is a standardized numbering system used to identify objects in the Management Information Base (MIB) and their hierarchy.
- Hierarchical Structure: OID represents a hierarchical naming system, where each node is a number representing a level in the tree.
- Starting from the Root: All OIDs begin from the root node (0) and then descend through the levels.
For example, OID 1.3.6.1.2.1.1.3.0 can be broken down as follows:
- 1: ISO identifier
- 3: Organization number
- 6: Company number
- 1: Management number
- 2: Standard number
- 1: MIB-II
- 1: System group
- 3: System uptime
- 0: Specific instance
How to Parse OID
We use the standard MIB library RFC1213-MIB as an example (replace with the appropriate MIB library as needed). RFC1213-MIB is one of the default MIB libraries, which includes management and monitoring items for various device statuses, network interface information, system resources, etc.
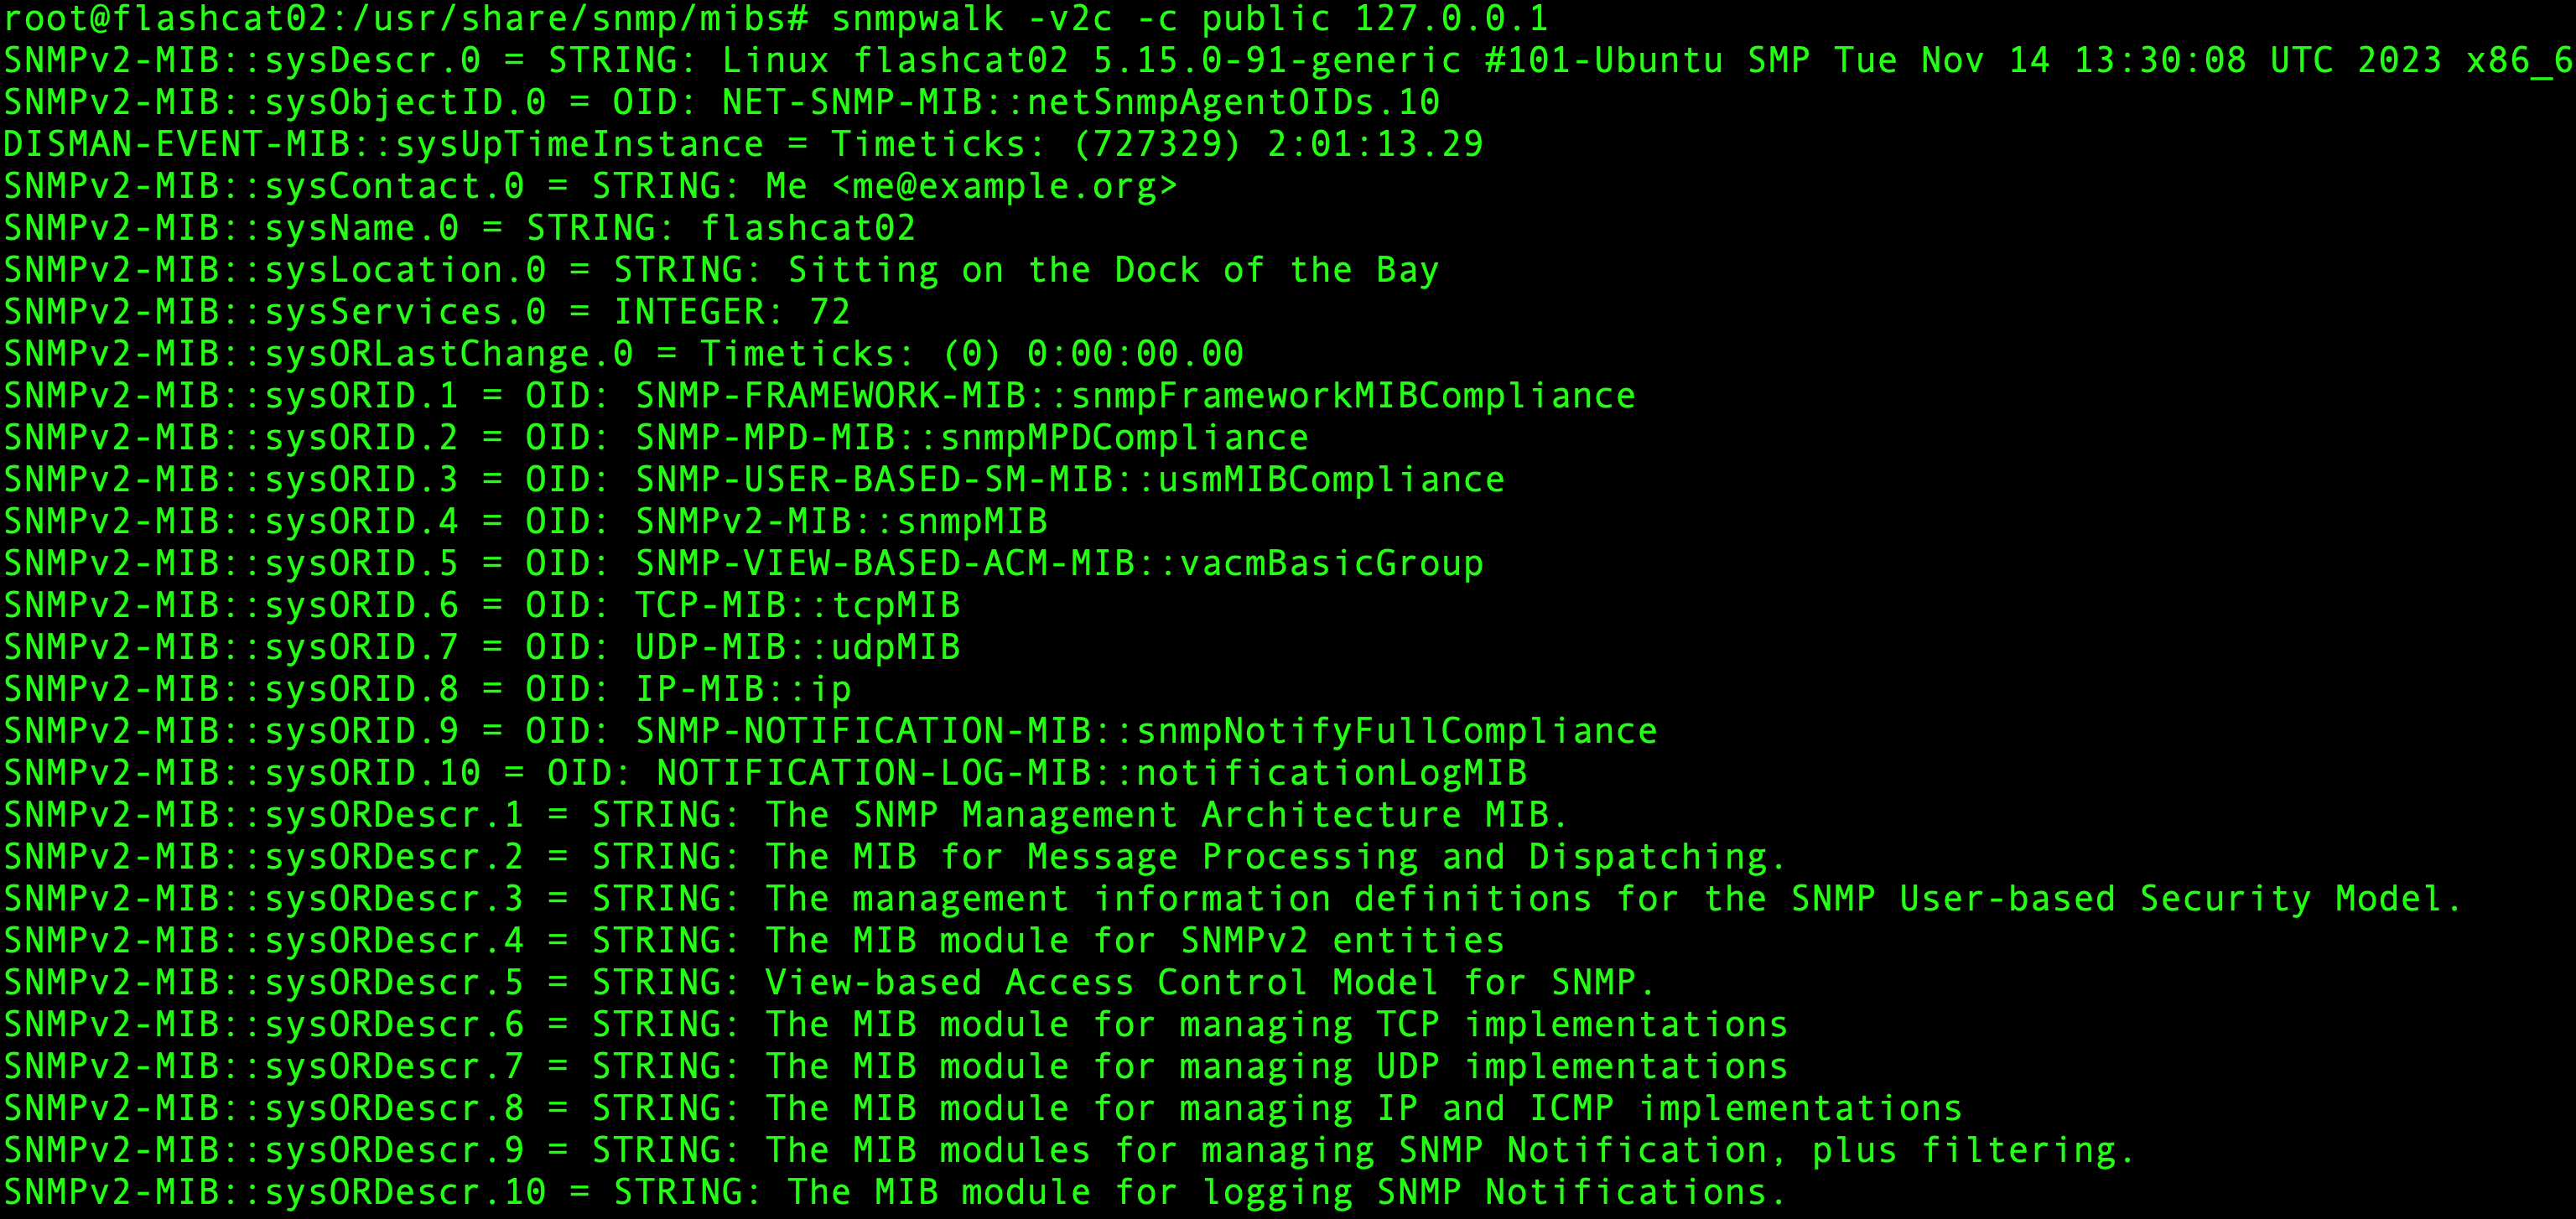
You can use the command snmpwalk -v2c -c public 127.0.0.1 to view all OIDs of the device, and you can fill in the OIDs into the configuration file based on your needs.
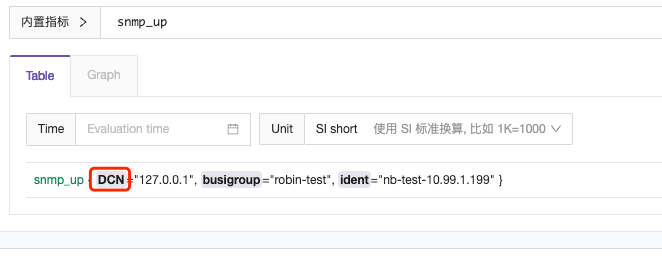
Once the template is saved, you can view the metrics in real-time queries.
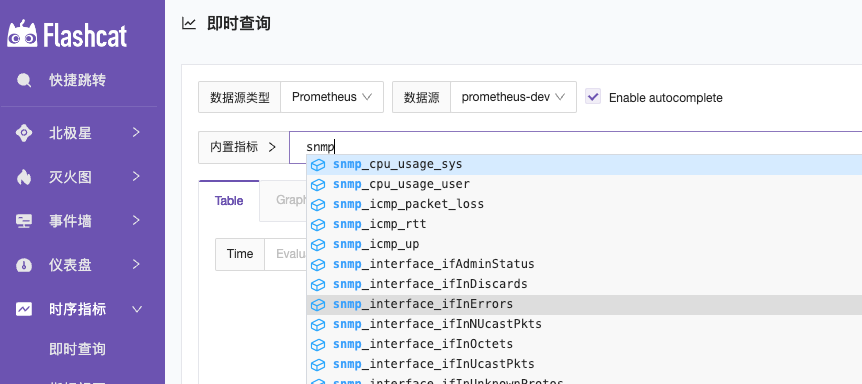
After saving the template, you can view the metrics in the Instant Query section.

Troubleshooting:
If you do not see relevant metrics after completing the configuration, you can run the following commands on the network device to check if there are any return values.
Normal Network Device Return Value:

No Return Value from Network Device:

Troubleshooting Directions:
- Ensure the OID path is correct, as different devices and manufacturers may use different OIDs to represent the same object.
- Check whether the SNMP is properly loading the relevant MIB modules.
- Verify if the network device uses private OIDs, which may require specific MIB modules or specific hardware or software support.
- Review the SNMPD configuration file for string (public) permissions and priority order issues.


