

ES log alerting allows you to detect abnormal logs through log query analysis and trigger alerts accordingly.
First, select the ES data source, then configure query conditions and alert conditions. Below is a detailed explanation of each numbered function:
1 Select Index
Supports multiple configuration methods:
- Specify a single index:
gb- search all documents in the gb index - Specify multiple indices:
gb,us- search all documents in both gb and us indices - Specify index prefix:
g*,u*- search all documents in any indices starting with g or u
2 Set Filter Conditions
Currently supports query string syntax. For detailed syntax, refer to ES Documentation
3 Set Log Fields
Click to select the date field in the logs
4 Set Log Query Time Range
For example, 5 minutes means the alert query will search logs from the past 5 minutes
5 Value Extraction
Statistical analysis functions for logs, such as count, sum, avg, min, max, etc.
6 Group By
Group logs by fields, for example, grouping by host field for count statistics. Results will be grouped by the host field
7 Alert Conditions
Statistical analysis values are assigned to variables A, B, C, etc. in the alert conditions, then alert judgments are made based on these variables. For example, $A > 10 means trigger an alert when log count exceeds 10
8 Advanced Configuration
In some scenarios where logs are delayed (e.g., 3 minutes delay), querying the last 3 minutes may return no data. In such cases, you can set a delay query time in advanced configuration. For example, setting a 180s delay means the end time for queries will be set to current time minus 180s
Usage Examples
Example 1: Alert Conditions for HTTP CODE 4xx
Description: Within every 10-minute period, check the message field in logs. If 4xx logs exceed 2 times, trigger an alert, with statistics grouped by host.hostname field. Configuration shown below:

Example 2: Alert When API Response Time Exceeds 1 Second
Description: Group statistics by http_method to monitor request interface response times exceeding 1 second. Configuration shown below:

Example 3: Alert When request_time Exceeds 1900ms and Matching Logs Exceed 10
Description: Within every 2-minute period, filter logs where request_time exceeds 1900ms. Group by request_uri dimension and check if log count exceeds 10. Configuration shown below:

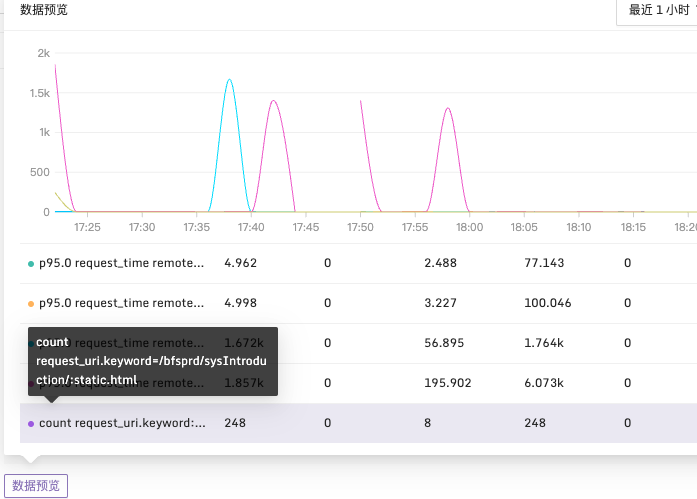
After configuring the required data fields, you can use the data preview button to preview query results.


